2022
From Chaos to Coordination:
Digitizing the waste supply chain for the Indian Government
Role
Founding Designer
Company
CityGen (by Towaso)
Product
1 SaaS web-app + 2 mobile apps
Team
1 Designer + 2 Co-founders
The Origin: During COVID, an unusual opportunity
In 2021, during the COVID-19 lockdown, our team became a finalist in the $400K ADB Innovation Challenge, representing India on a global stage focused on solving real-world waste management problems.
The challenge wasn’t about building another civic app.
It was about reimagining how entire cities manage waste: from the moment trash leaves a household to the moment it reaches a recycling facility.
Our entry combined:
A patent-pending handheld device that captured a photo of collected waste and recorded its weight
A vision to digitize every stakeholder touchpoint: households, waste collectors, supervisors, and ULB officers
A behavioral bet: traceability builds accountability, and accountability drives change
The video below, used as our ADB entry, explains the problem we set out to solve across the global waste supply chain:
Introduction
This wasn’t a portfolio piece. This was going to be used to pitch national governments, international juries, and actual users across municipalities.
I led the design of a three-part platform:
A mobile app for supervisors and ground staff
A mobile app for urban residents
An analytics dashboard for ULB administration
These mockups helped us become Global Finalists in the $400K ADB challenge.
But more importantly, they became the blueprint for a product now moving toward deployment in India.
Problem Statement
Across India, Urban Local Bodies (ULBs) operate with a fragmented waste infrastructure.
Most rely on third-party agencies for waste collection.
The result?
Missed pickups
Revenue leakage
Zero real-time visibility
No trust between residents and municipality
On top of that, less than 20% of recyclable waste is actually recovered, because households don’t segregate waste, and there's no system to track or incentivize it.
We needed to design a platform that could:
Digitize offline operations
Track ground-level performance
Promote behavior change around segregation
Collect the urban data needed for future service mapping
This case study covers how we did it: starting from scratch.
Diving into the research
Before I could get to design, there were a lot of gaps that needed to be filled.
I needed to know about every service that was currently being provided to Indian households by Indian Urban Local Bodies (ULBs)
I wanted to learn about every step ULBs take to offer daily services to Indian households.
Why do developed countries have more optimized waste supply chain management?
Whether my peers (from Indian families) feel the need for a digital infrastructure? What are their thoughts?
So I dived into detailed research for four weeks.
Initial research
I focused on two things while starting:
Existing products
Stakeholder interviews
I scoured the internet to find every product ULBs were offering to solve Indian consumers’ daily waste collection issues (if any).
I could only find this one application:
The Swachhata application
It is a complaint redressal mobile and web platform. It eases how Municipal Corporations in India redress complaints and grievances.
Even though it was out of my problem statement’s scope, I wrote down summaries for each collection of screens.
I had one-on-one conversations with people who had a vested interest in the success of the outcome I was working on:
ULB executive officers and staff
I discussed the technical obstacles that Urban Local Bodies wanted and needed to overcome. I had periodic information exchanges with IEC cum SWM expert (an official consultant to ULB).
He helped me forward my questionnaire to higher ULB executives, whom he met in person daily.
Indian Households
I talked with my parents and four neighboring families regarding their daily waste collection problems and frustrations.
I also asked how they'd like the ULBs to solve them.
These were the people who'd make or break adoption.
Key insights of research
Primary research gave me insights that were categorized into three parts:
ULB Human Resource Management
Door-to-door waste collection
Complaints & requests redressal
The ideas based on this research were more realistic and precise than my initial thoughts.
Validated points:
Since the staff has to work in the field and not in the office, it is hard to keep track of their productivity.
It’s hard to track the whereabouts of the workforce deployed in the field.
Added points:
Inventory availability is hard to update for smooth functioning.
Workforce planning is a significant challenge that ULBs face.
The basis of appraisals and promotions is blurry due to lack of performance statistics.
There’s no leave management system.
Due to the offline system, the salary distribution is a bit tiresome.
Validated points:
Services provided by agencies are often inconsistent, and collection time may vary every day.
Consumers (households) are usually unhappy with the irregular collection because they often miss the garbage vehicle.
Added points:
Households are not promoted to segregate waste before disposal.
Since there is no Source Segregation of Waste and very few Material Recovery Facilities, ULBs are also losing revenue because of not being able to sell Dry Waste to Recyclers.
Only 18% of the recyclable waste is recycled due to unsegregated garbage collection.
ULBs are currently suffering from a revenue leakage in Door-to-Door Waste Collection Taxes of around 80% of the total expected monthly revenue.
Validated points:
Consumers often contact the door-to-door waste collectors regarding grievances like dead animals, nearby garbage dumps, sweeping not done, etc.
Consumers have to take time from their busy schedule to go to the Municipal office during working hours to post requests.
Contact details of the ULB administrative body members are unavailable / hard to find to consumers.
It is hard to keep track of the progress, and follow-ups are difficult over the call.
Added points:
Consumers are unaware that they can post complaints and requests directly to ULBs via apps online.
Also, the consumers who know about such apps choose not to download them since they solve only one purpose.
Research summary
The root problem wasn’t just lack of digitization.
It was lack of visibility, structure, and feedback loops across all three actors: the ULB, the staff, and the citizen.
My job was to design three MVP products from scratch:
A mobile app for ULB field staff
A mobile app for urban residents
An admin dashboard for ULB officers
Each product had to serve a real need while helping the company gather the urban infrastructure data it needed for long-term business goals.
Reframing with HMWs
I translated pain points into "How Might We" statements:
How might we
onboard the entire ULB structure (zones, wards, officers, inventory) into one system?How might we
help field staff document service without adding friction?How might we
promote waste segregation at the point of pickup?How might we
digitize tax collection and reduce leakage?How might we
make citizens care, without making them work?
The solution
I designed a three-part platform:
ULB Admin Mobile App
For supervisors and field agents to manage tasks, onboard entities, collect taxes, and resolve complaints.Resident Mobile App
For urban citizens to monitor their pickup history, make payments, submit requests, and get nudges on waste segregation.ULB Web Dashboard
For administrative staff to monitor operations, view live maps, manage HR, track revenue and material flow, and audit ground data.
Prioritizing features
Right after getting approval for our proposed solution from the ULB, the Co-founders of CityGen and I prioritized the application features via remote closed card sorting sessions (due to COVID lockdown).
The process helped us decide:
What should go on the admin app UI screens
How to structure the onboarding flows for 18 different entities
What data mattered most to ULB leadership (e.g. segregation rates vs. collection volume)
What behavioral nudges we could realistically push to consumers
ULB Admin
mobile app
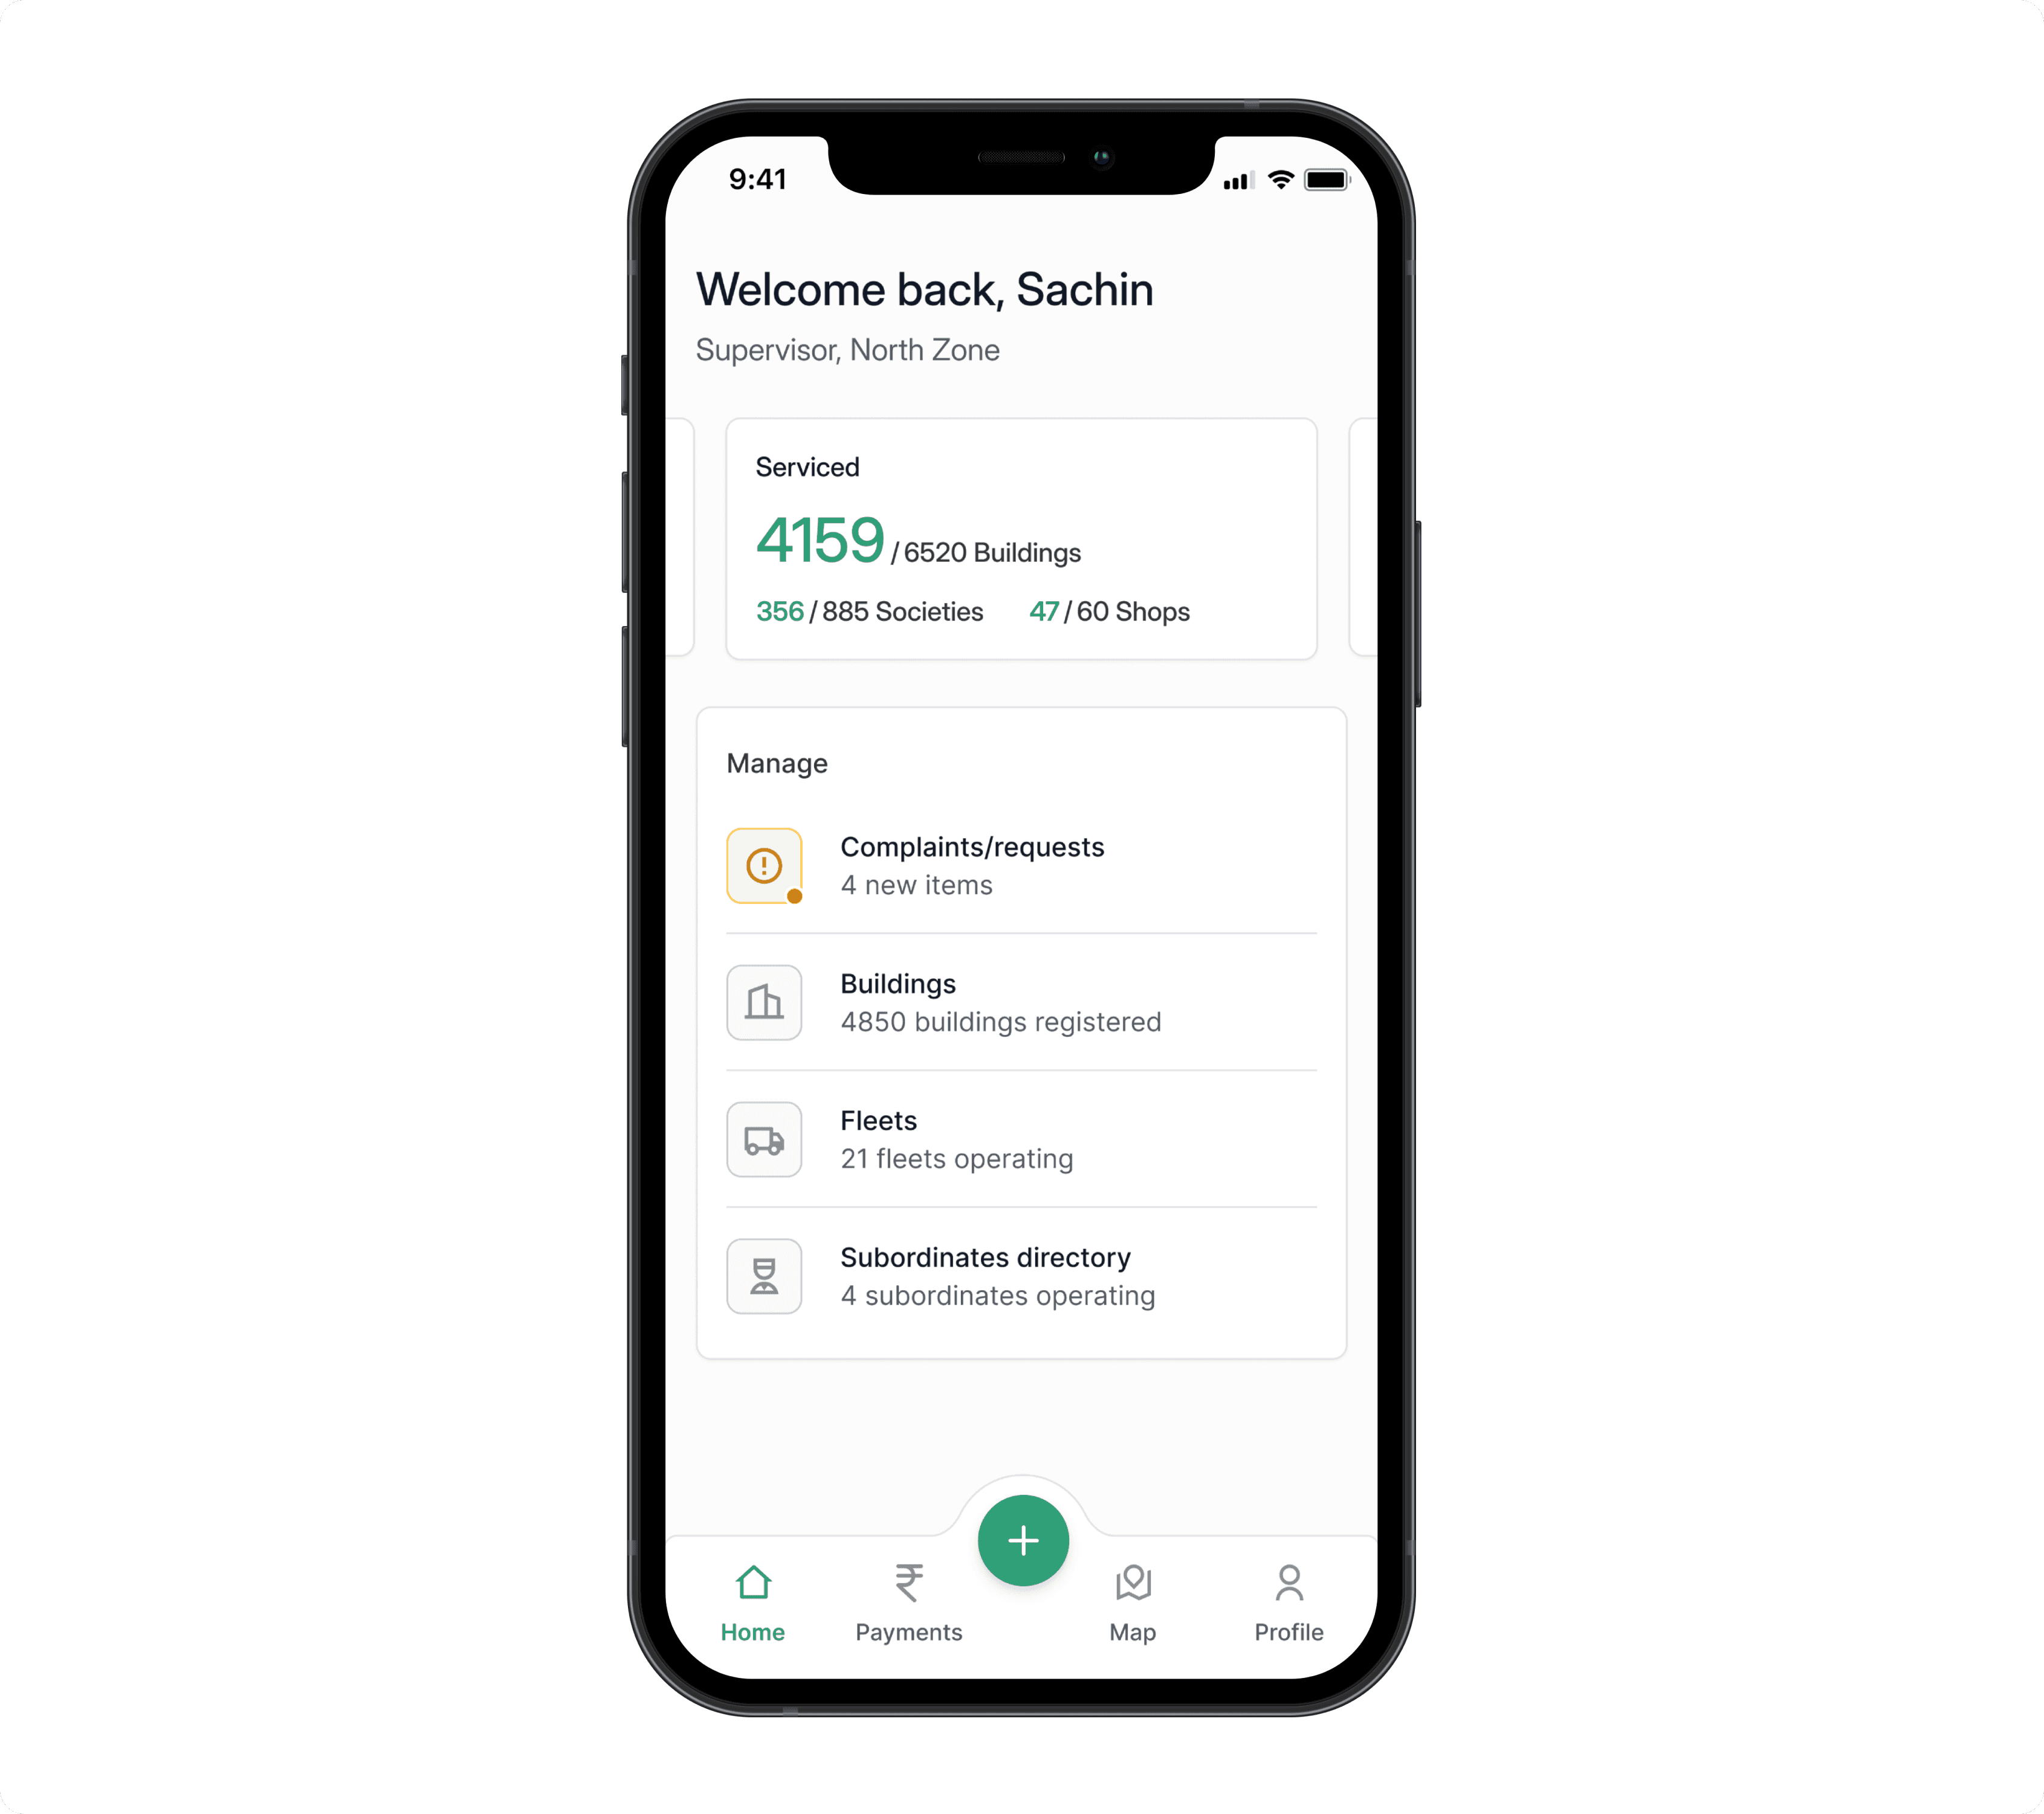
This app was to be used by the ULB workforce. The UI dynamically adapts based on the user’s role in the ULB hierarchy.
Homescreen
For this walkthrough, I’ll focus on the Supervisor: a key operational role, but not part of the top-level administration.
Supervisors lead ground teams (fleets) and are responsible for:
Onboarding new households and commercial units
Collecting payments for waste collection services
Resolving complaints and handling special sanitary requests submitted by citizens through the resident app (covered later in this case study)
Their version of the app is designed for fast, task-driven execution with tools tailored to field realities.
A core screen for the ULB Supervisor, who is responsible for collecting payments from residents.
While residents receive monthly bills through the consumer-facing mobile app (and can pay digitally), the majority of citizens in 2021 still preferred cash. That meant Supervisors had to collect payments door-to-door and then submit the collected amount to the ULB cashier.
The UI supports this workflow in three parts:
Payment Defaulters
Highlights residents who have missed more than one payment cycle, helping the Supervisor prioritize collection.Monthly Collection
A structured directory that organizes residents by area or household ID, making it easier to plan and track collections in the field.Pay to Cashier
Once cash is collected, the Supervisor can log the total and either initiate a digital transfer or mark the amount as manually submitted at the ULB office.
This screen wasn’t just about logging money.
It helped bring accountability and structure to a workflow that previously relied on paper records and memory.
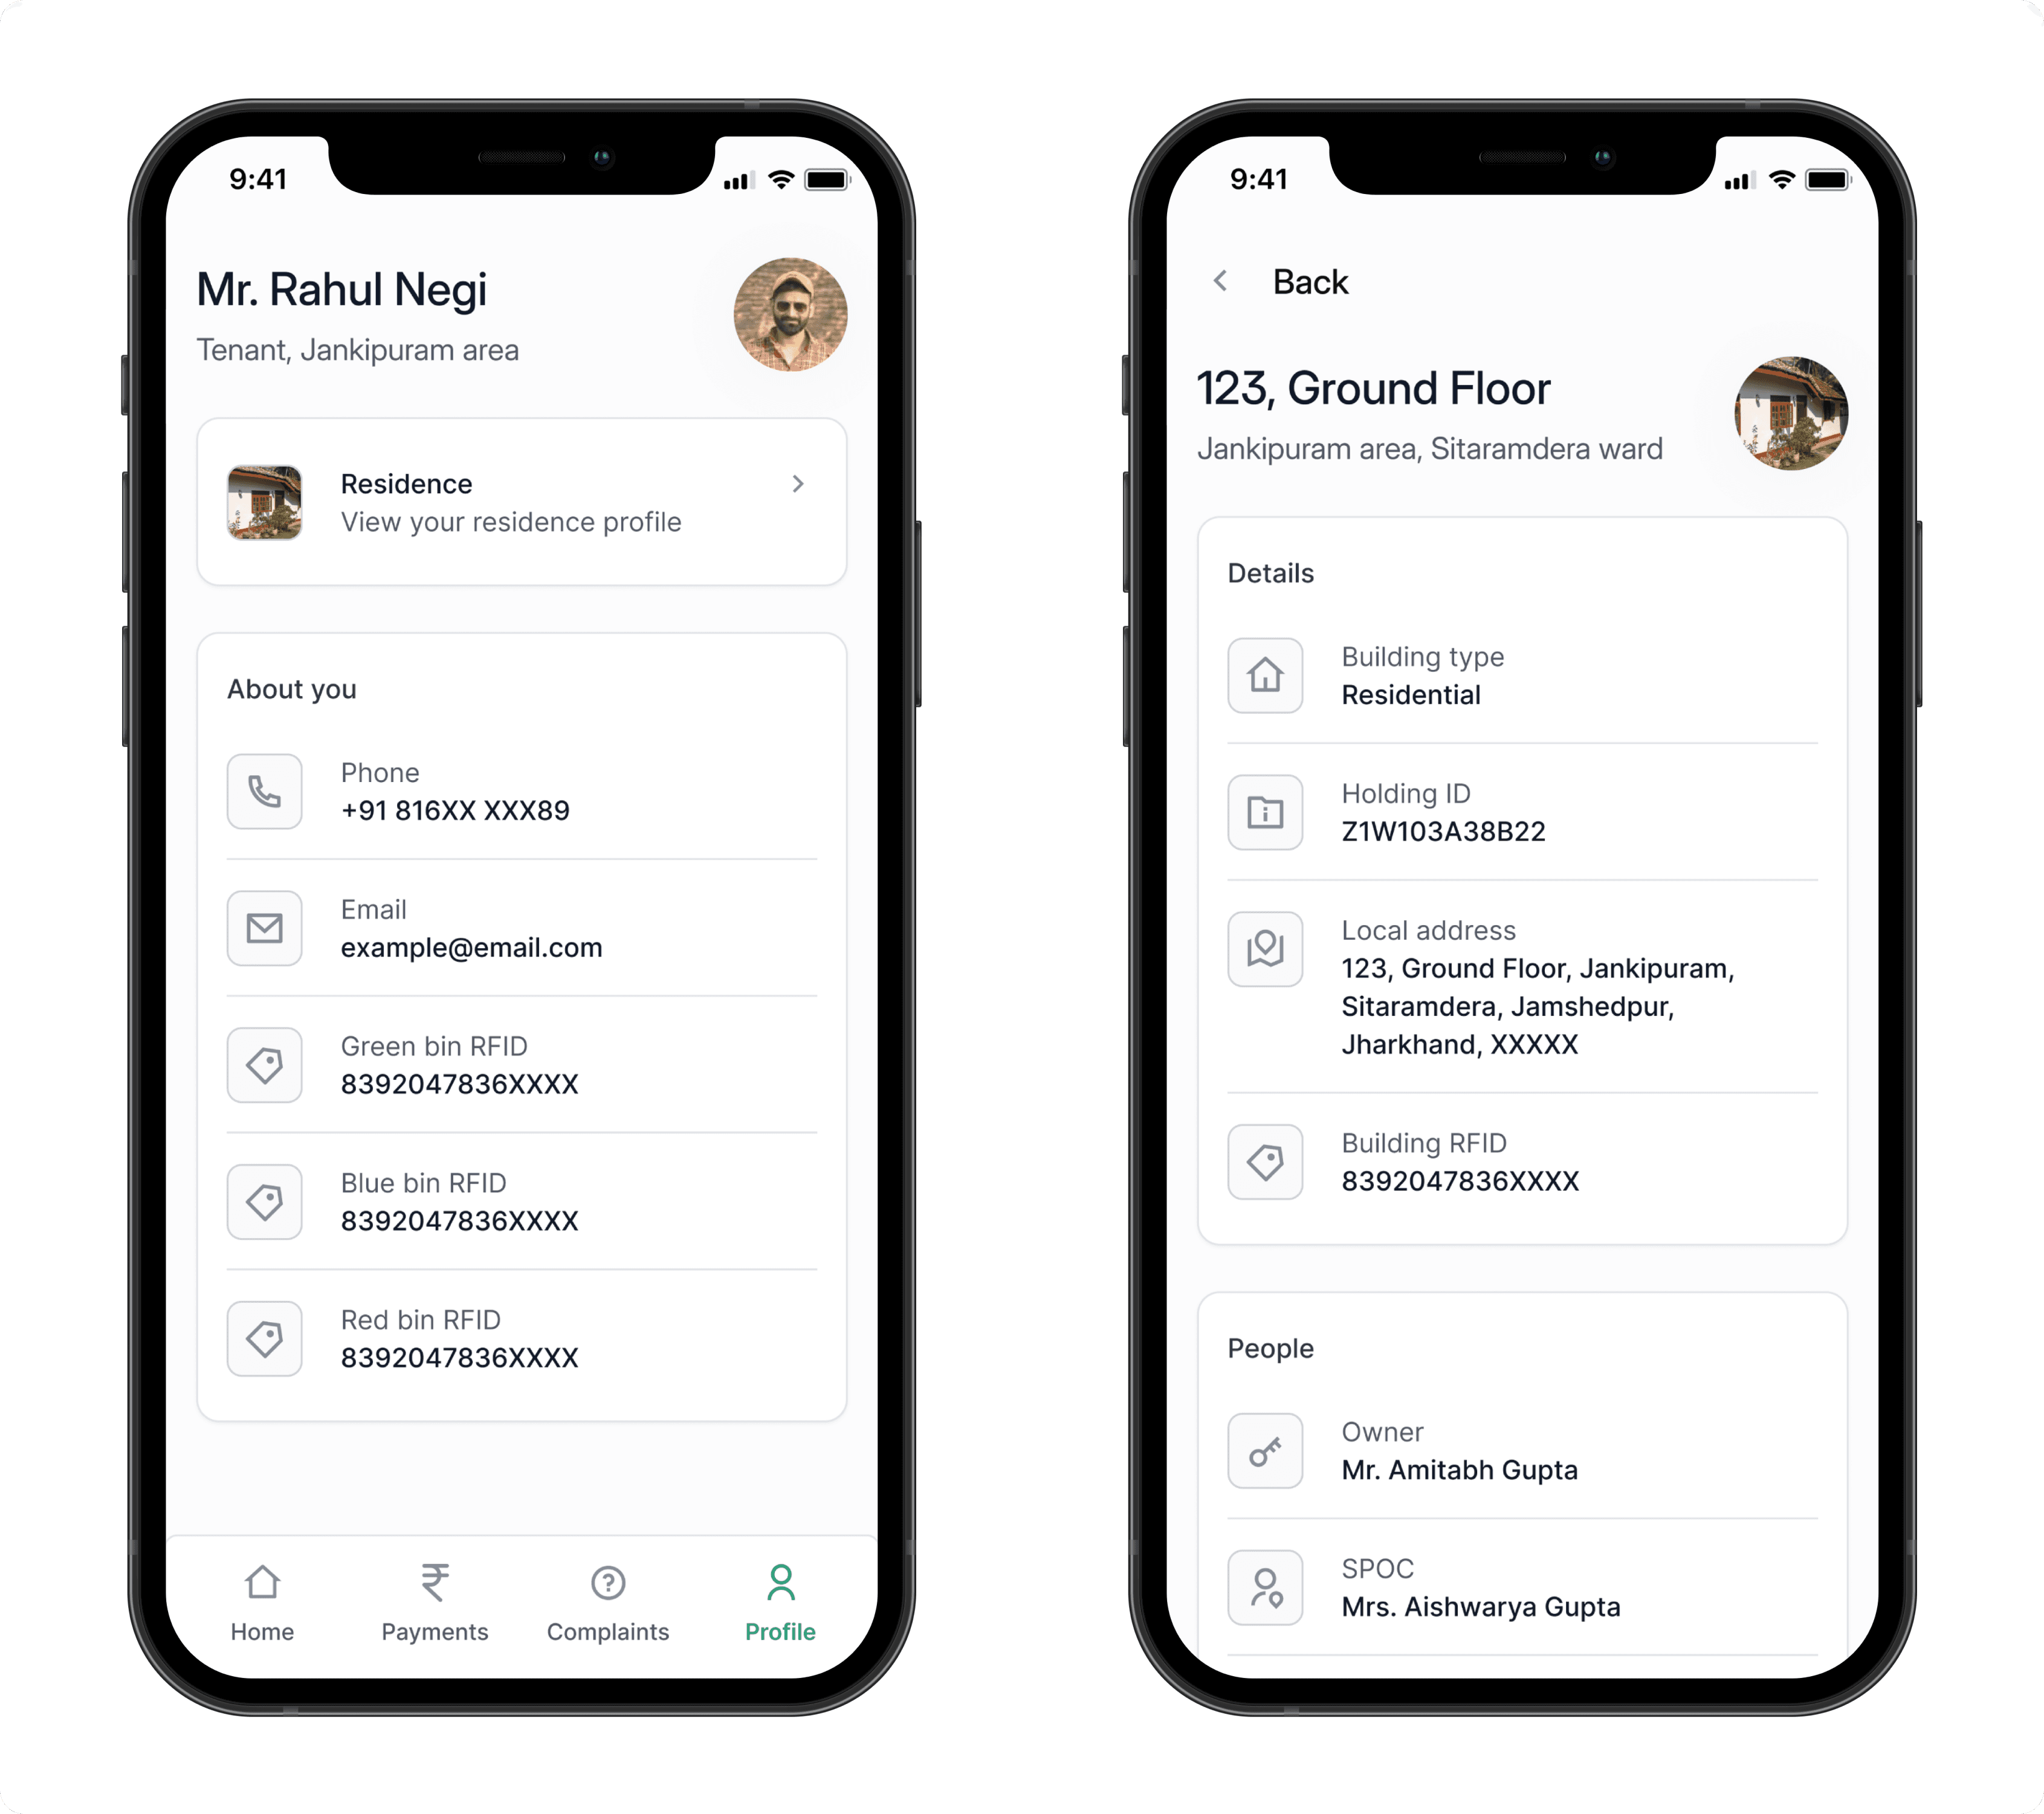
This screen acts as the central onboarding hub, and like all screens in the system, it adapts dynamically based on the user’s role.
The version shown here reflects the full access granted to the highest-ranking officer. It includes every entity type that can be onboarded into the system: consumers, staff, vehicles, inventory, and more.
This flow will see the heaviest use during the early rollout phase, as the ULB transitions from offline records to a fully digital system.
Since we’re walking through the supervisor’s experience, one of their core tasks will be onboarding new consumers. Here’s a sample flow that shows how that journey is handled within the app:
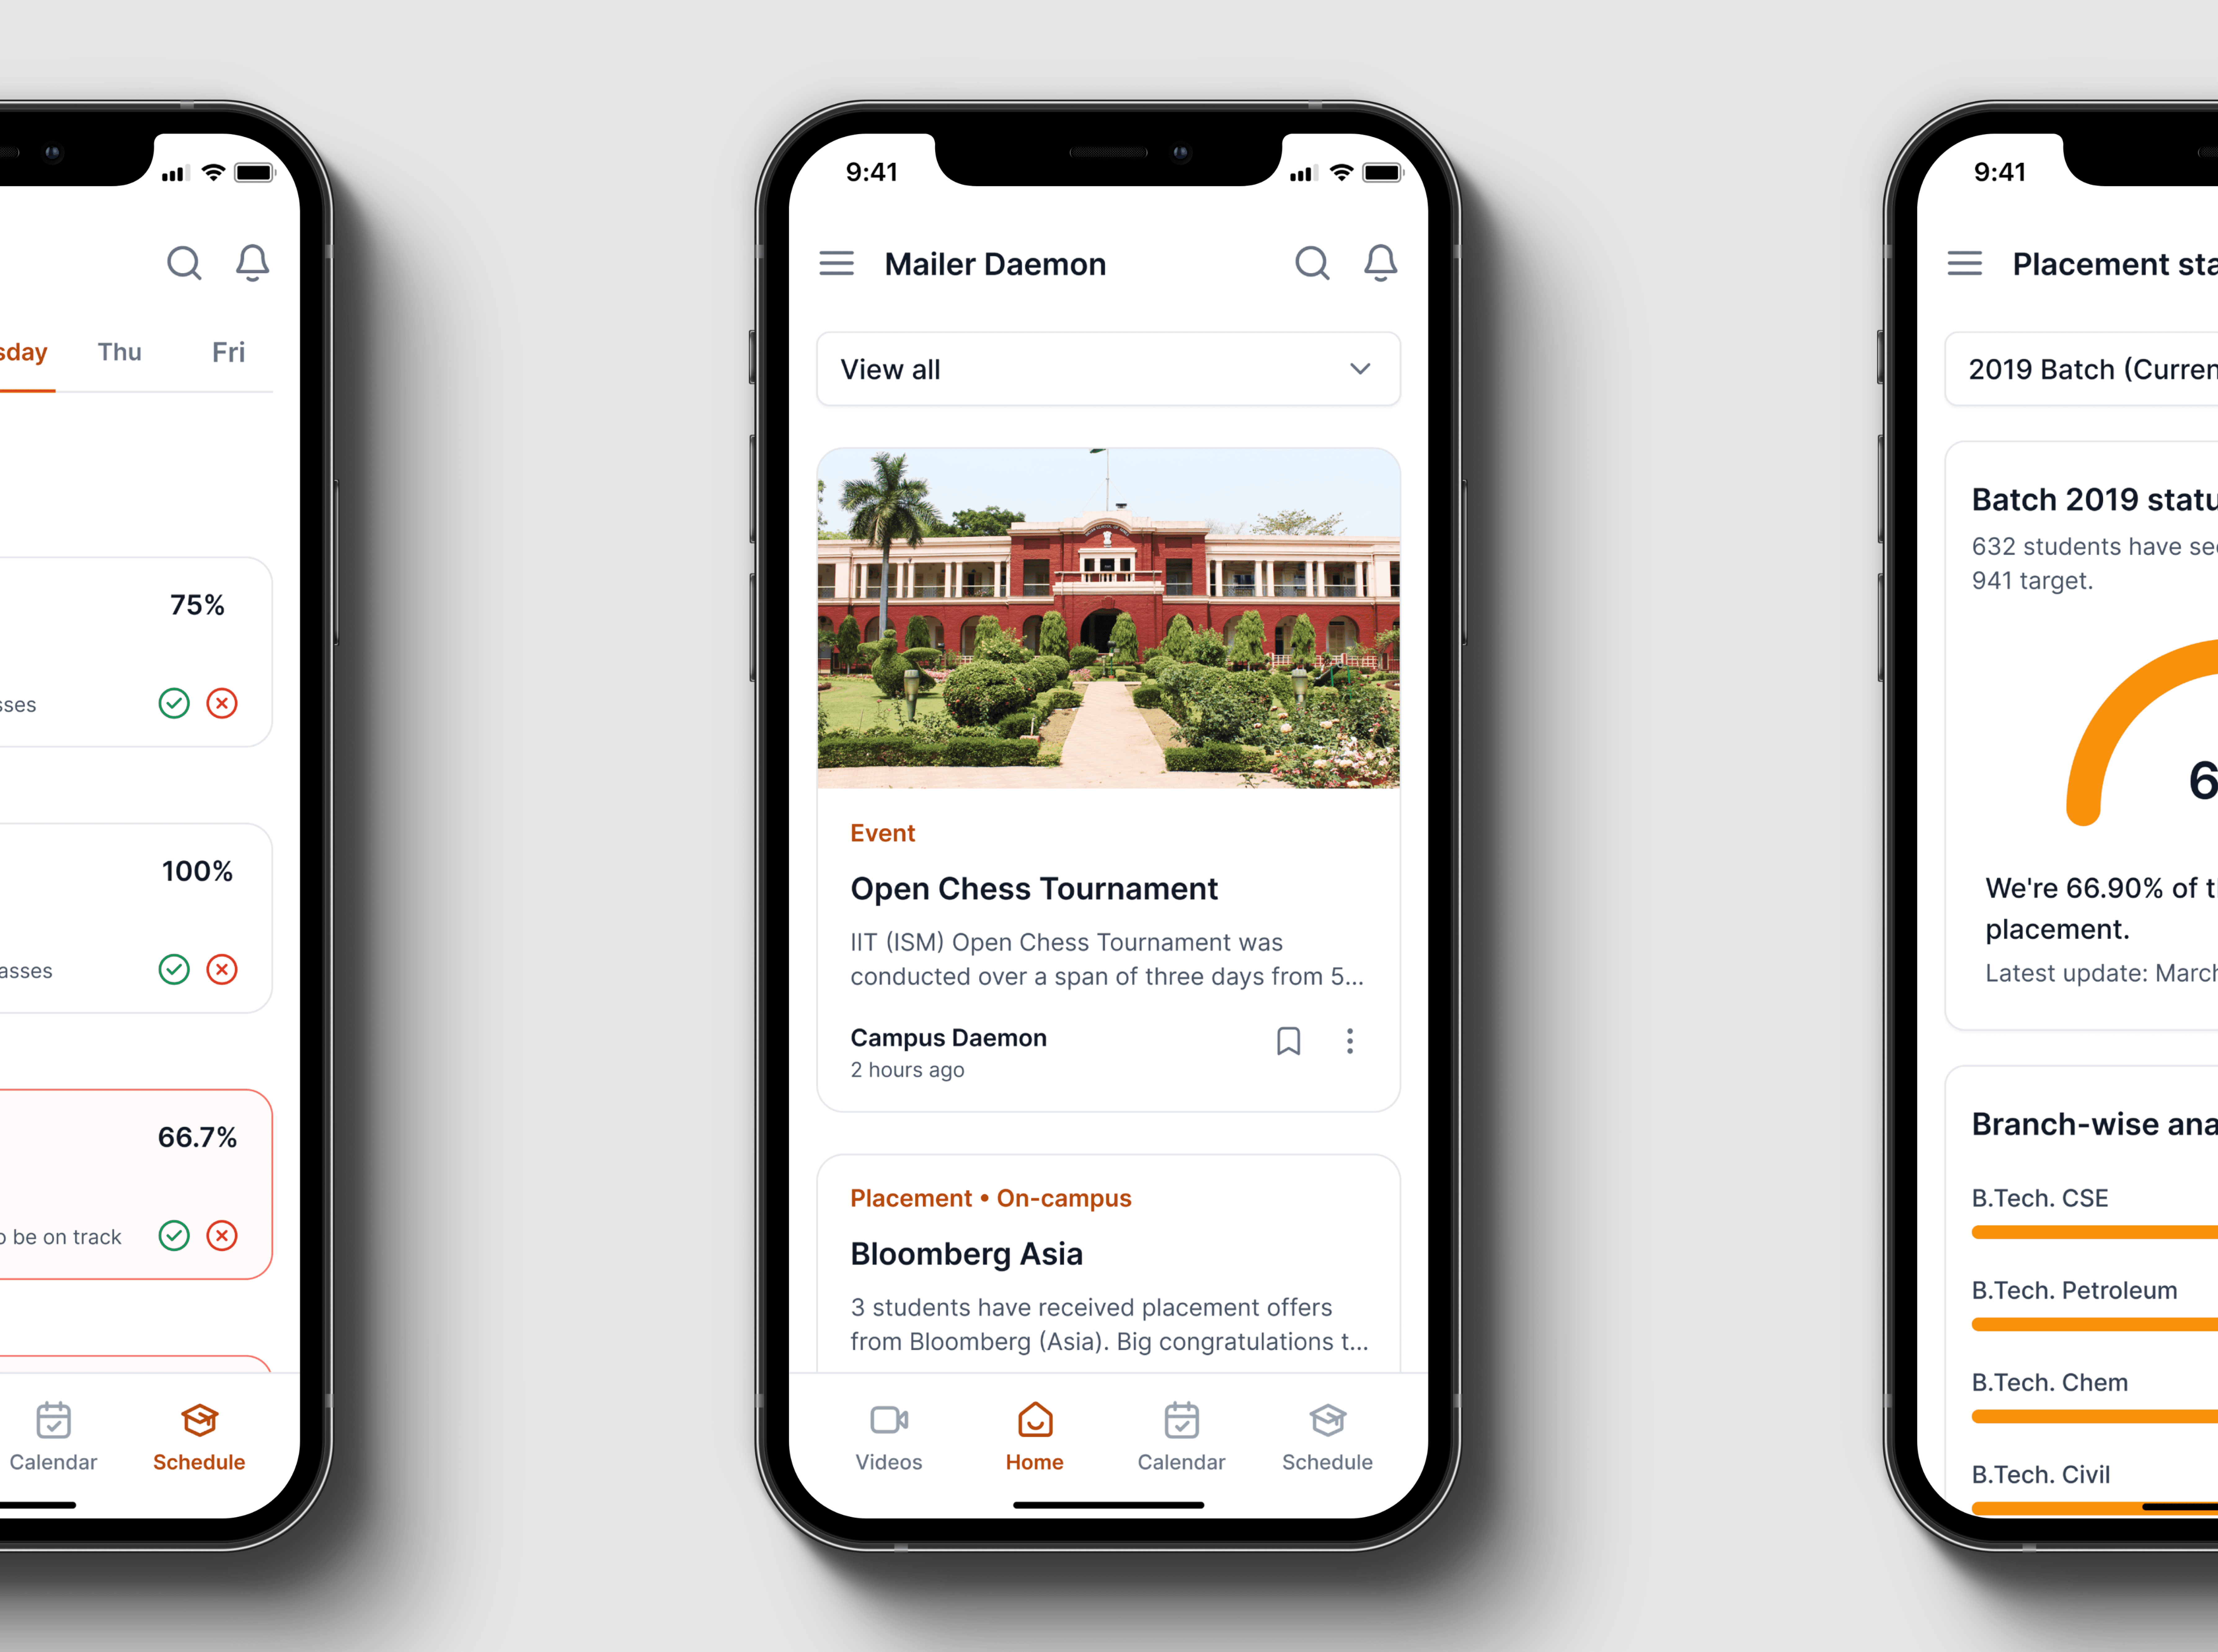
Complaints and service requests followed the same resolution flow, and were accessible directly from the home screen.
For supervisors, managing redressals was a core responsibility, and often the most visible signal of public trust.
Each submission moved through a simple, trackable status flow:
On the Job – work has been assigned and initiated
Resolved – the issue has been addressed
Re-opened – if the resident isn’t satisfied and follow-up is needed
This flow gave both residents and ULB staff a clear, shared view of what was happening and what still needed attention.
Because roles and responsibilities vary across staff and officers, the content here is fully dynamic. In this case, the user is a supervisor, so the primary actions center around onboarding buildings and residents and collecting payments.
When location access is enabled, this screen also acts as a passive activity log. Higher-level officers can review completed tasks with timestamped geolocation, creating lightweight accountability without additional manual work.
Supervisors can also track their attendance, leave status, and submit future leave requests directly from this screen, reducing reliance on offline HR workflows.
The citizen mobile app
This app was designed for everyday citizens and that meant designing for 3 distinct user types:
Residents living in individual households (owners or tenants)
Apartment society managers
Shopping complex administrators
Each group had different workflows, but they all shared one underlying need: a reliable, transparent waste collection service that didn’t require constant follow-up.
For this case study, I’ll walk through the experience designed for the most common user type: a household resident.
The home screen of the citizen app acts as the central dashboard, surfacing four key touchpoints that mattered most to residents.
1. Pickup Tracker
At the top, users can see when the garbage collector is expected to arrive, along with a live route map showing how many stops are left before reaching their home.
This was the most requested feature during interviews. It solved the daily uncertainty around missed pickups.
2. Carbon Credit Wallet
To promote waste segregation, we introduced a gamified incentive system: carbon credits. Each time a resident disposed of segregated waste correctly, they received credits in their wallet.
These credits could be redeemed to partially offset their monthly municipal bill. Over time, this became a behavioral nudge that turned good habits into visible rewards.
3. Calendar View
This visual timeline helped users see their waste disposal behavior across the month.
It showed which days they submitted segregated waste, mixed waste, or missed a pickup, either due to absence or vehicle delay.
4. Monthly Summary
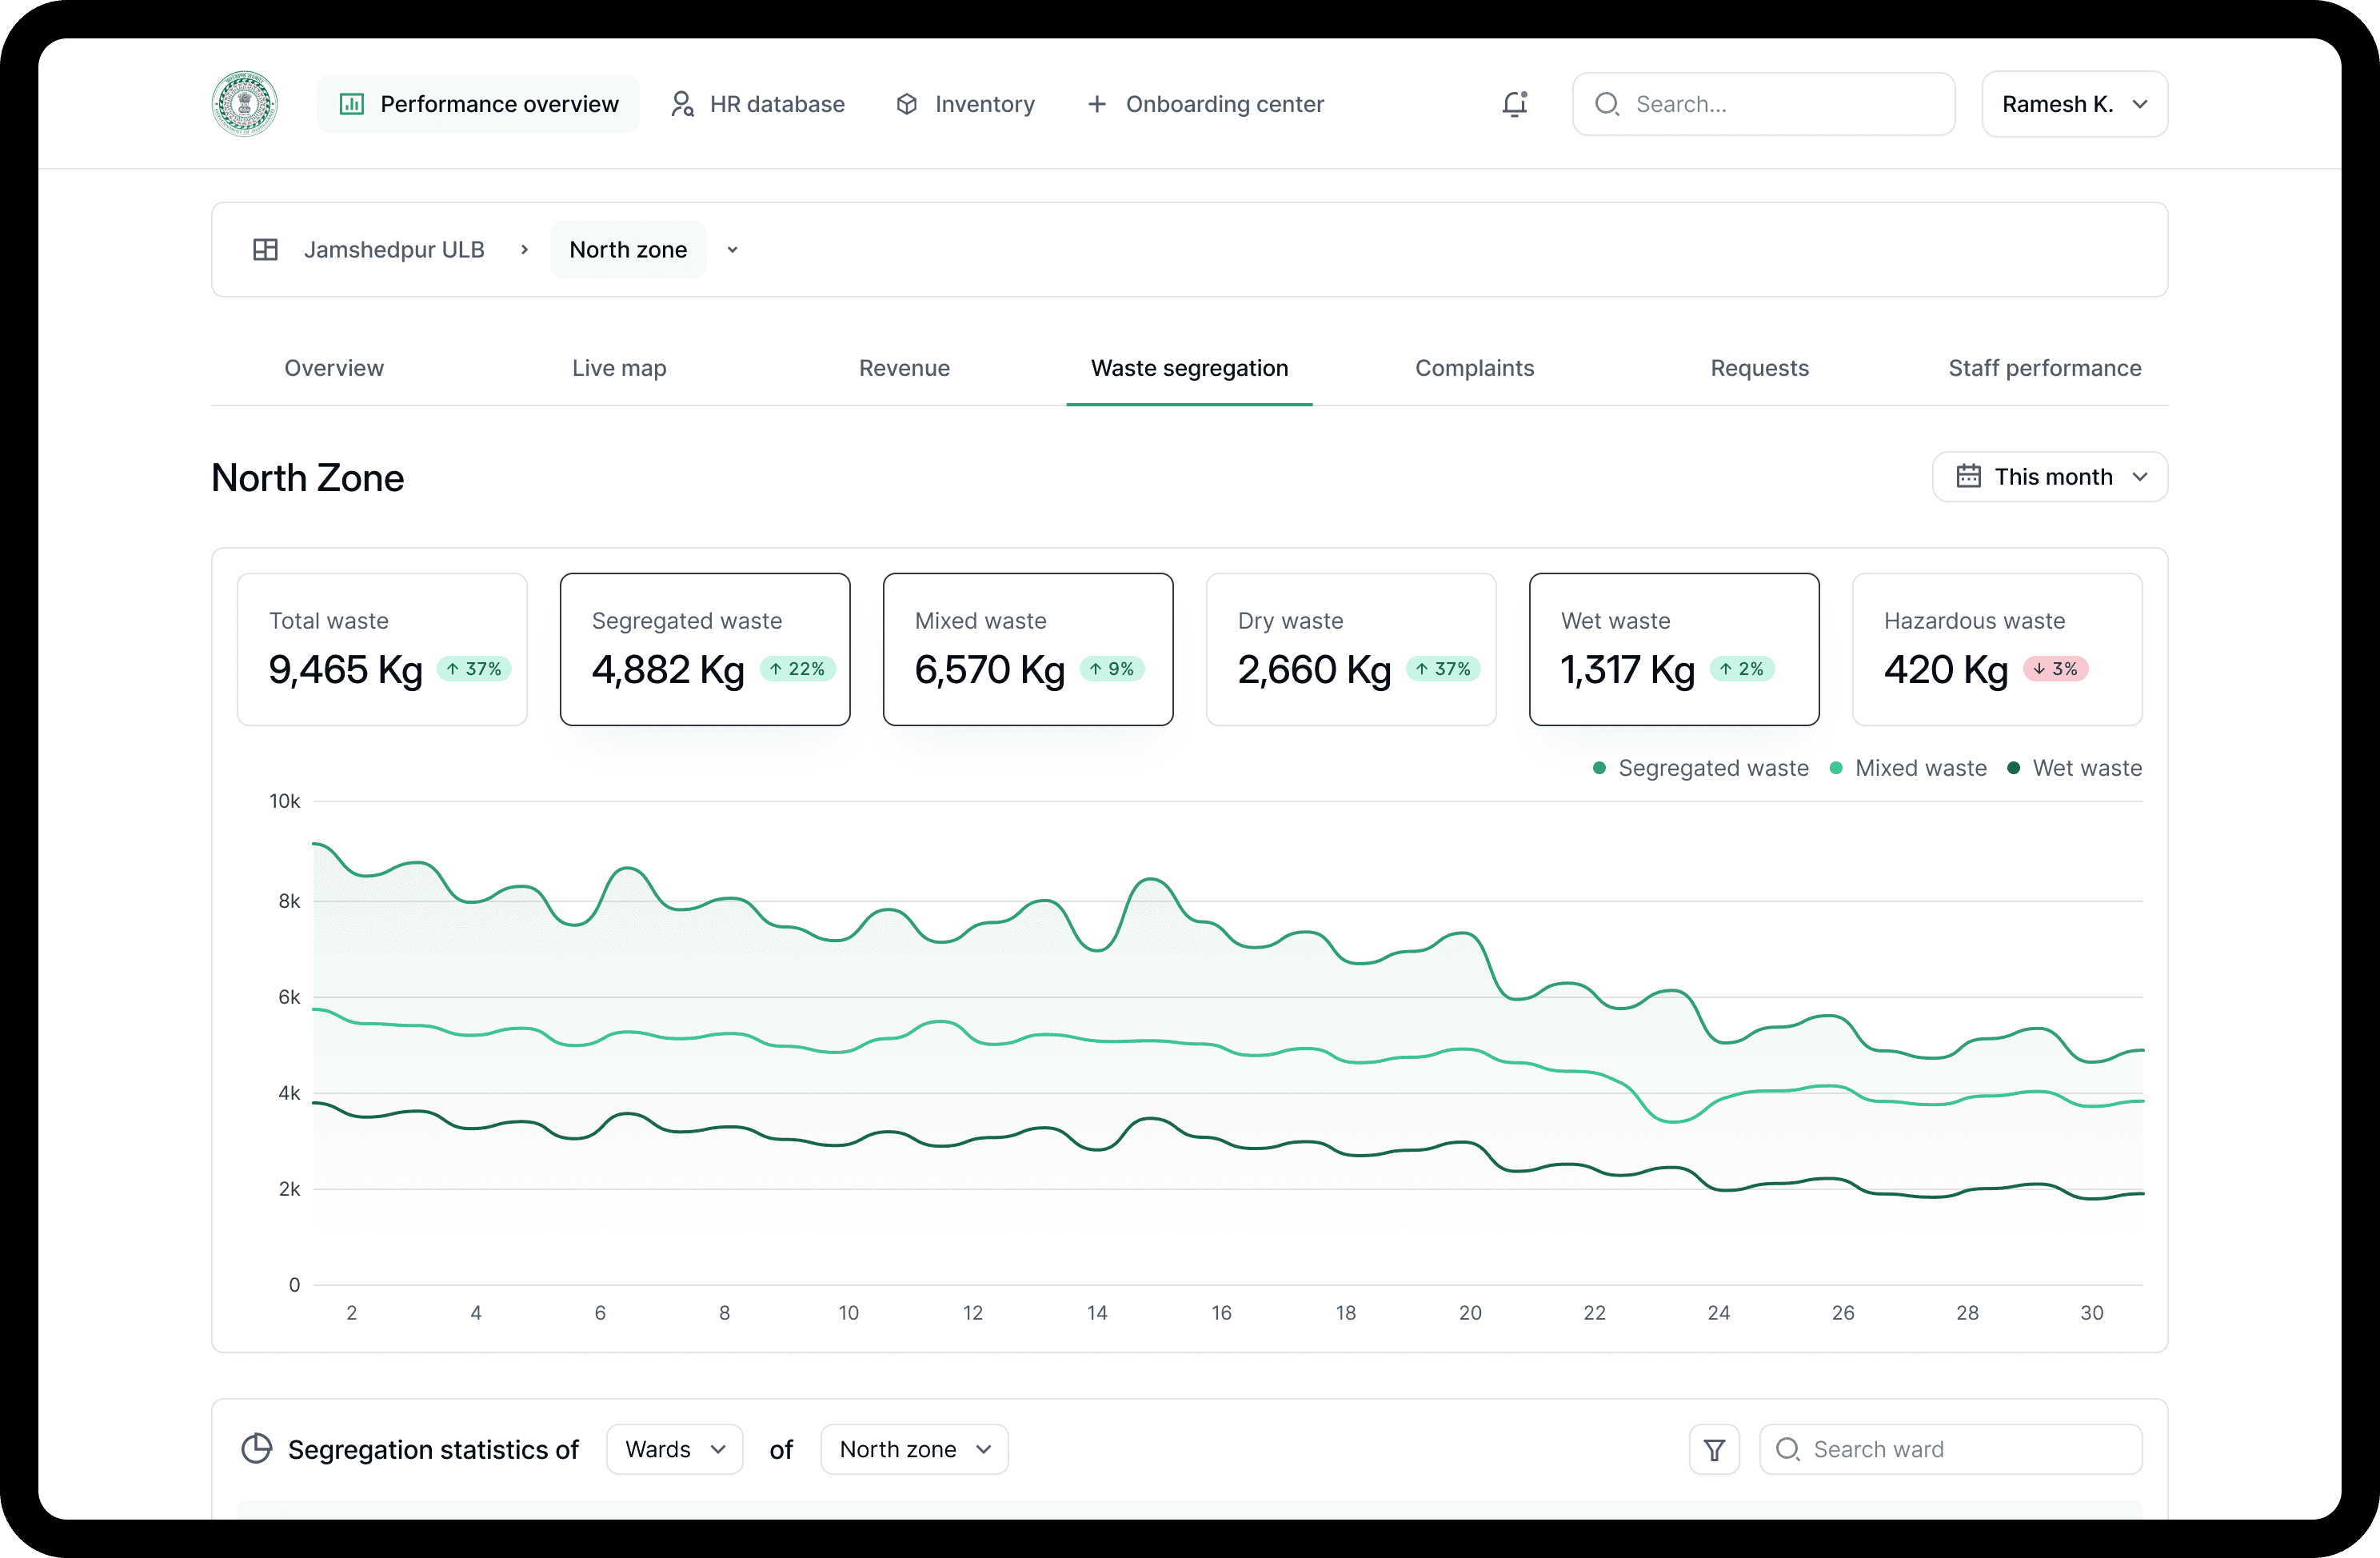
At the bottom of the dashboard, users could view a detailed summary of their segregation performance: total waste generated, segregation percentage, and weight (in kg), all broken down by category.
Although users could pay their monthly service bills online, many still relied on the manual method, where a supervisor visited homes to collect payments. But when collections were missed or users forgot to pay on time, we needed a fallback.
The Payments Center screen gave residents a clear view of any overdue bills, with a simple, mobile-first flow to complete pending payments instantly.
In India, Urban Local Bodies (ULBs) already offered complaint and service request mechanisms. For example, citizens could report unclean areas in their locality or request basic sanitation support at home. But during interviews, one insight became clear: almost no one knew these services existed.
At the same time, dissatisfaction with public cleanliness came up repeatedly. There was a gap. Not in service availability, but in awareness and access.
To bridge that, we introduced a Complaints & Requests section in the consumer app. Citizens could now:
Submit detailed reports with images and geolocation
Request sanitation-related help for their home
Track the status of their submissions in real time
On the ULB side, these requests were routed directly to supervisors via the Admin mobile app. As shown in earlier flows, supervisors could view, act, resolve, or reopen requests; ensuring accountability and feedback loops were finally in place.
The final key surface was the profile section, designed to adapt based on user type.
This screen dynamically adjusts its components depending on whether the logged-in user is a property owner or a tenant.
For this case study, I’ve shown the version tailored for a tenant; highlighting how access, service records, and billing visibility shift based on role.
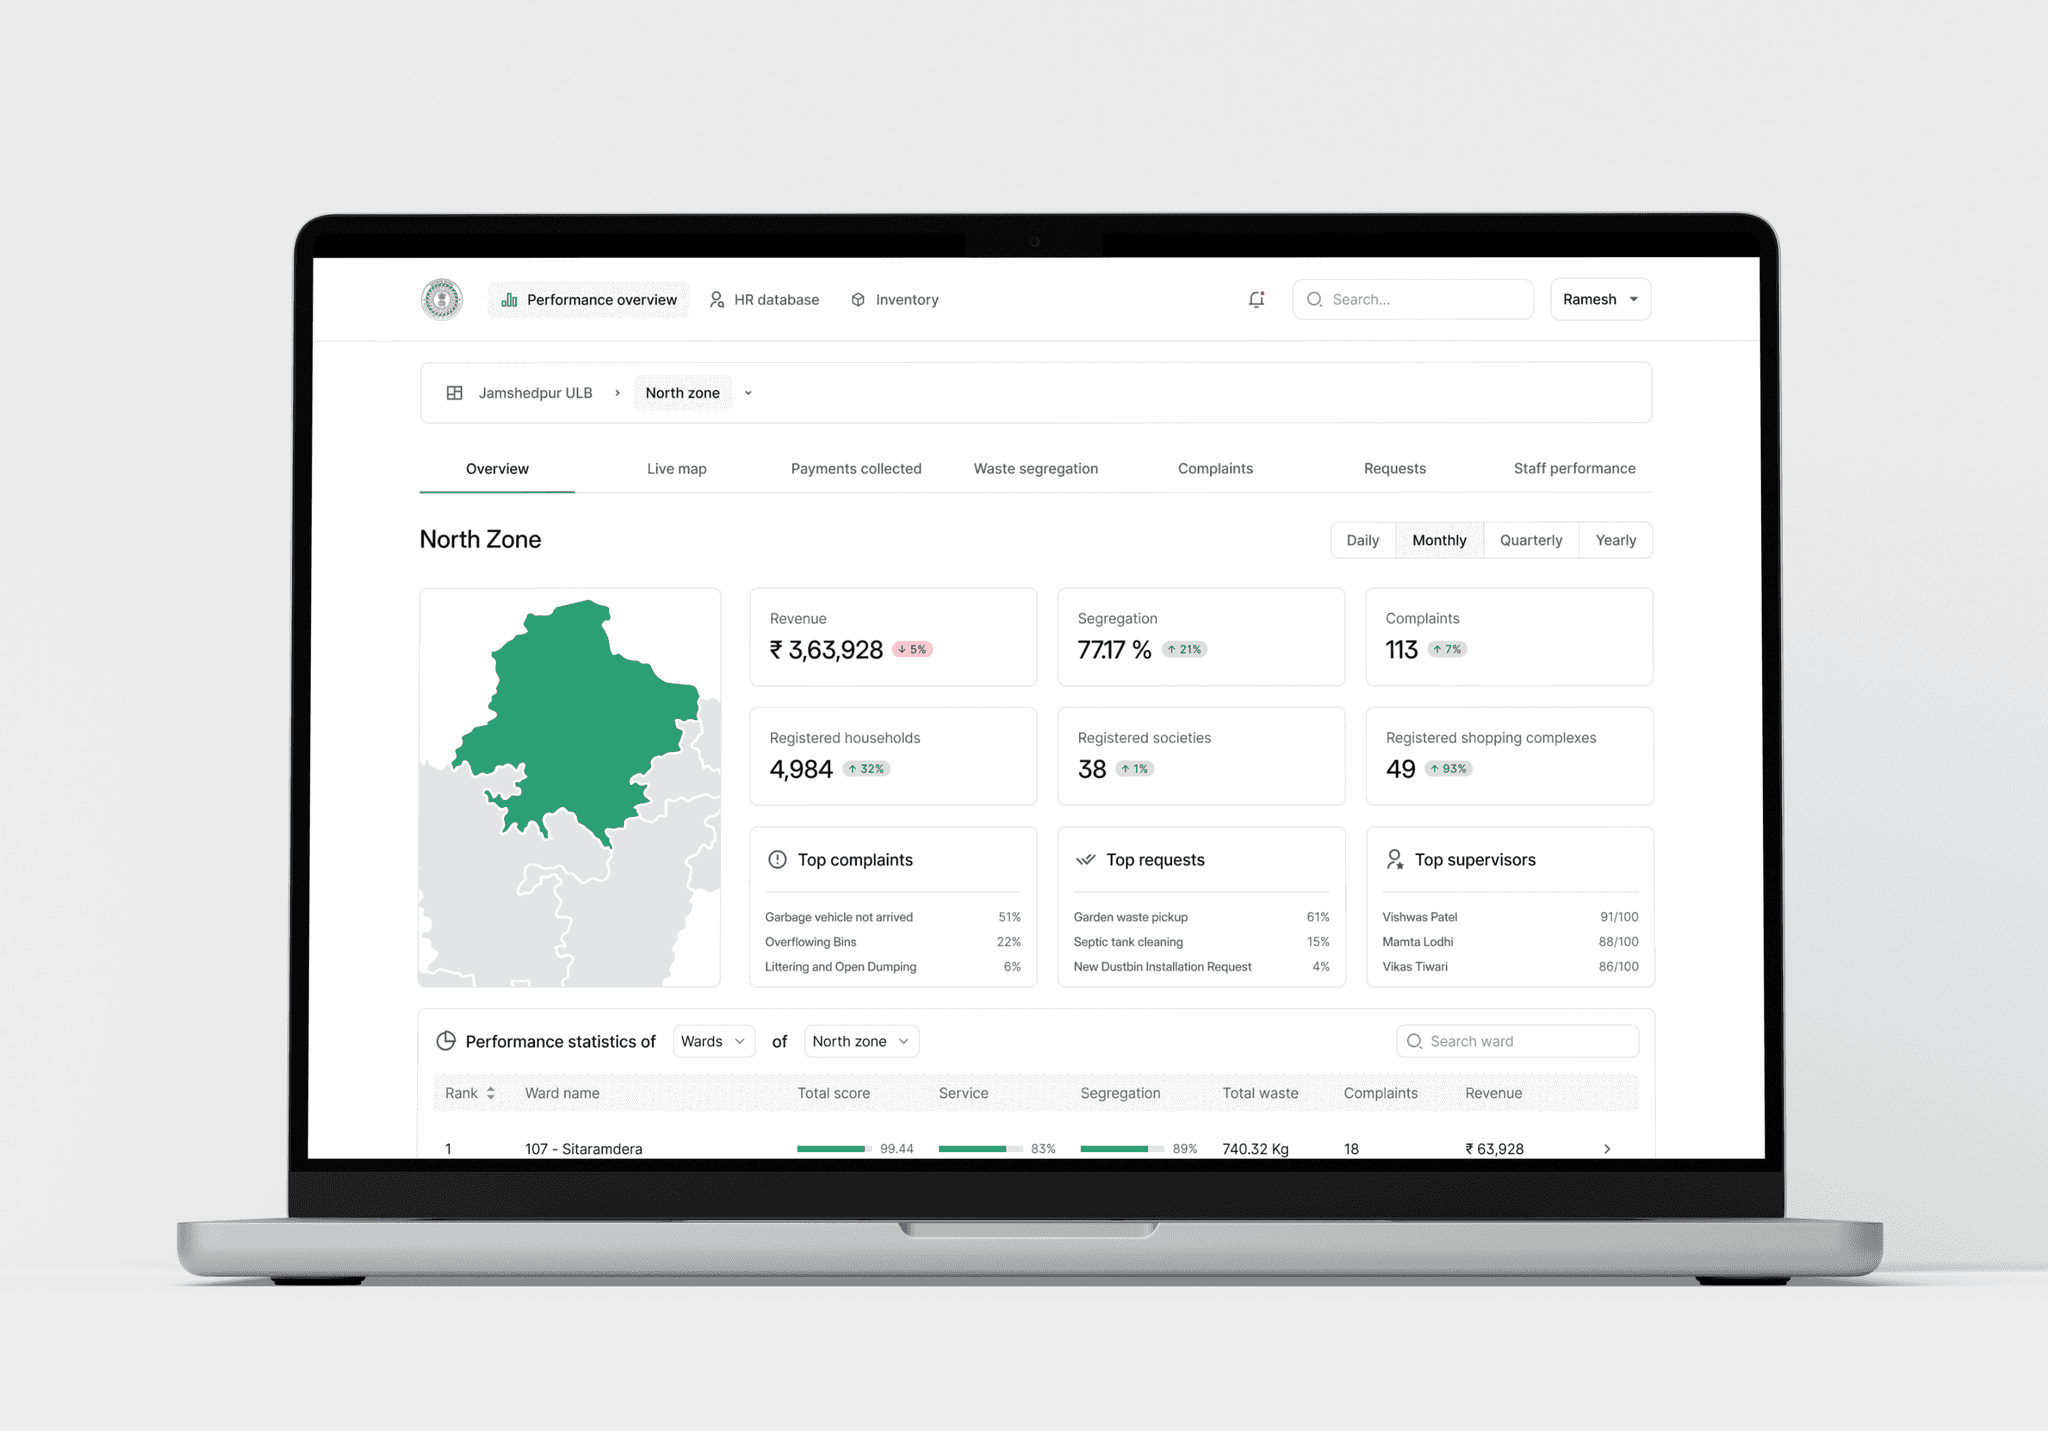
The ULB dashboard
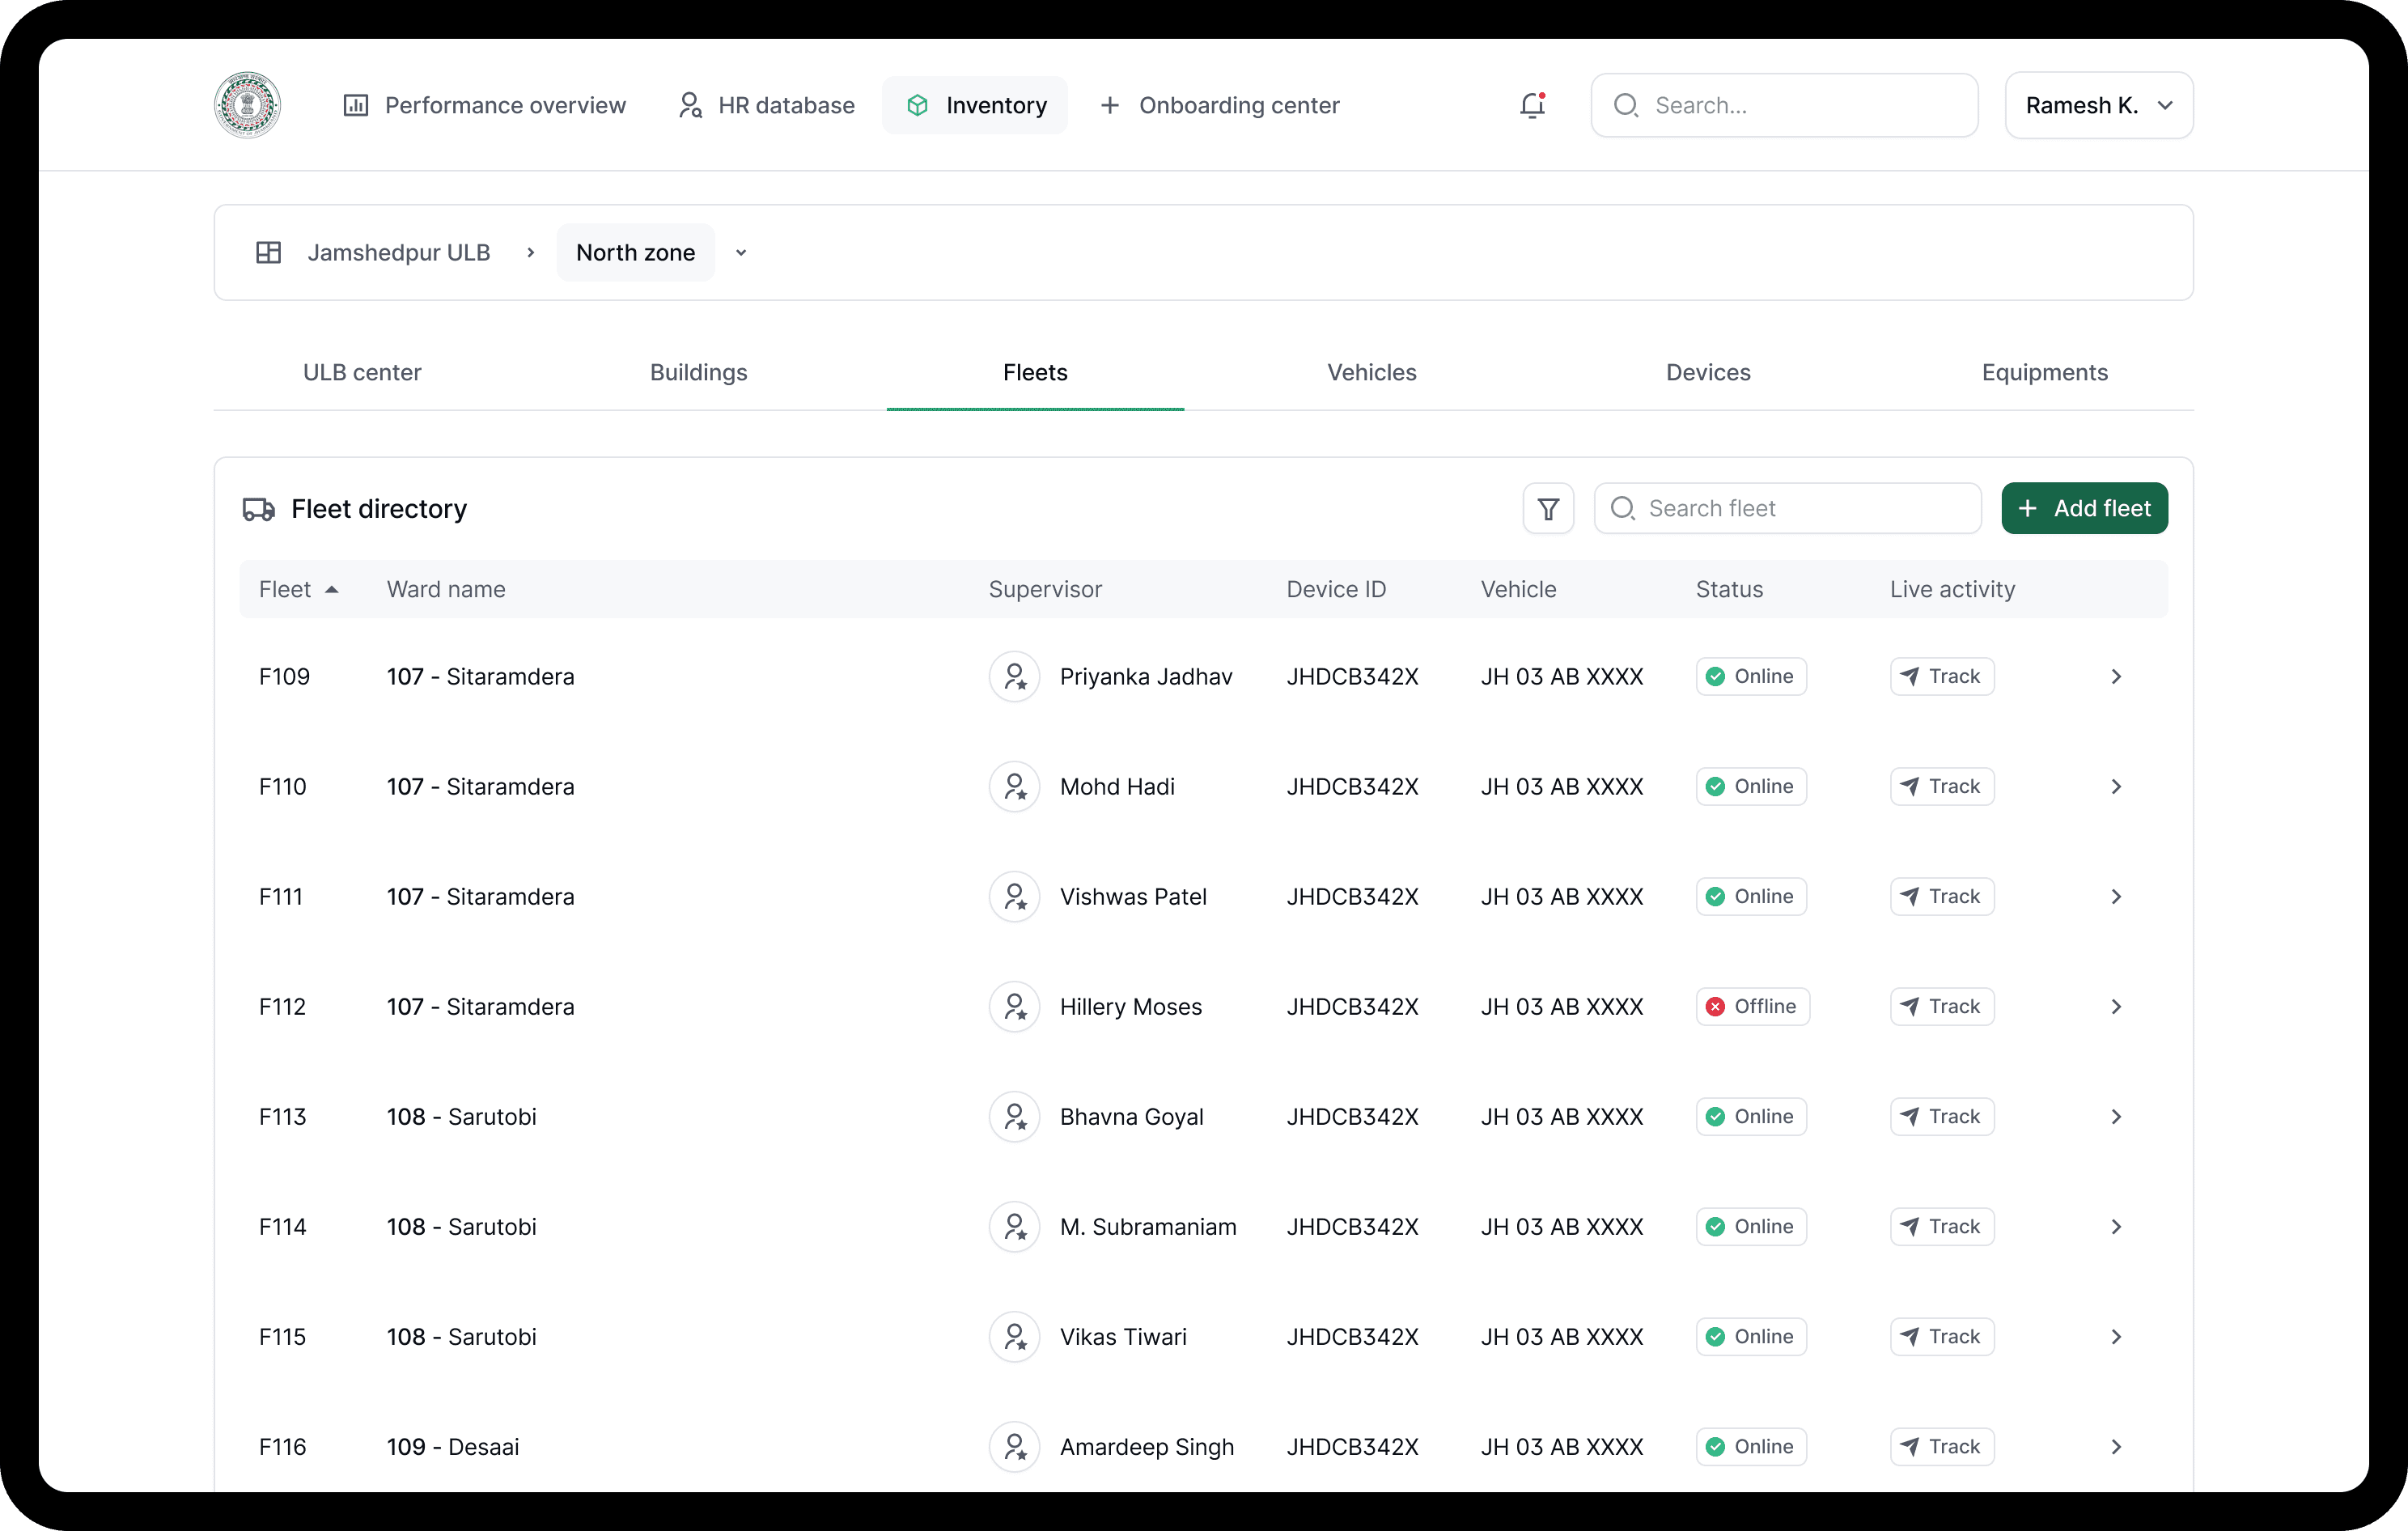
The final product in the system was the ULB Admin Dashboard - a web-based tool designed for officers working at municipal headquarters.
These officers were responsible for overseeing operations across their assigned zones; ranging from full-city oversight to a single ward or area.
The dashboard dynamically adjusted based on user roles, showing only the data and controls relevant to their level of authority.
For this case study, I’ve showcased the views available to the highest-level officer: the ULB In-Charge, with access to full organizational visibility across all performance, segregation, and operations data.
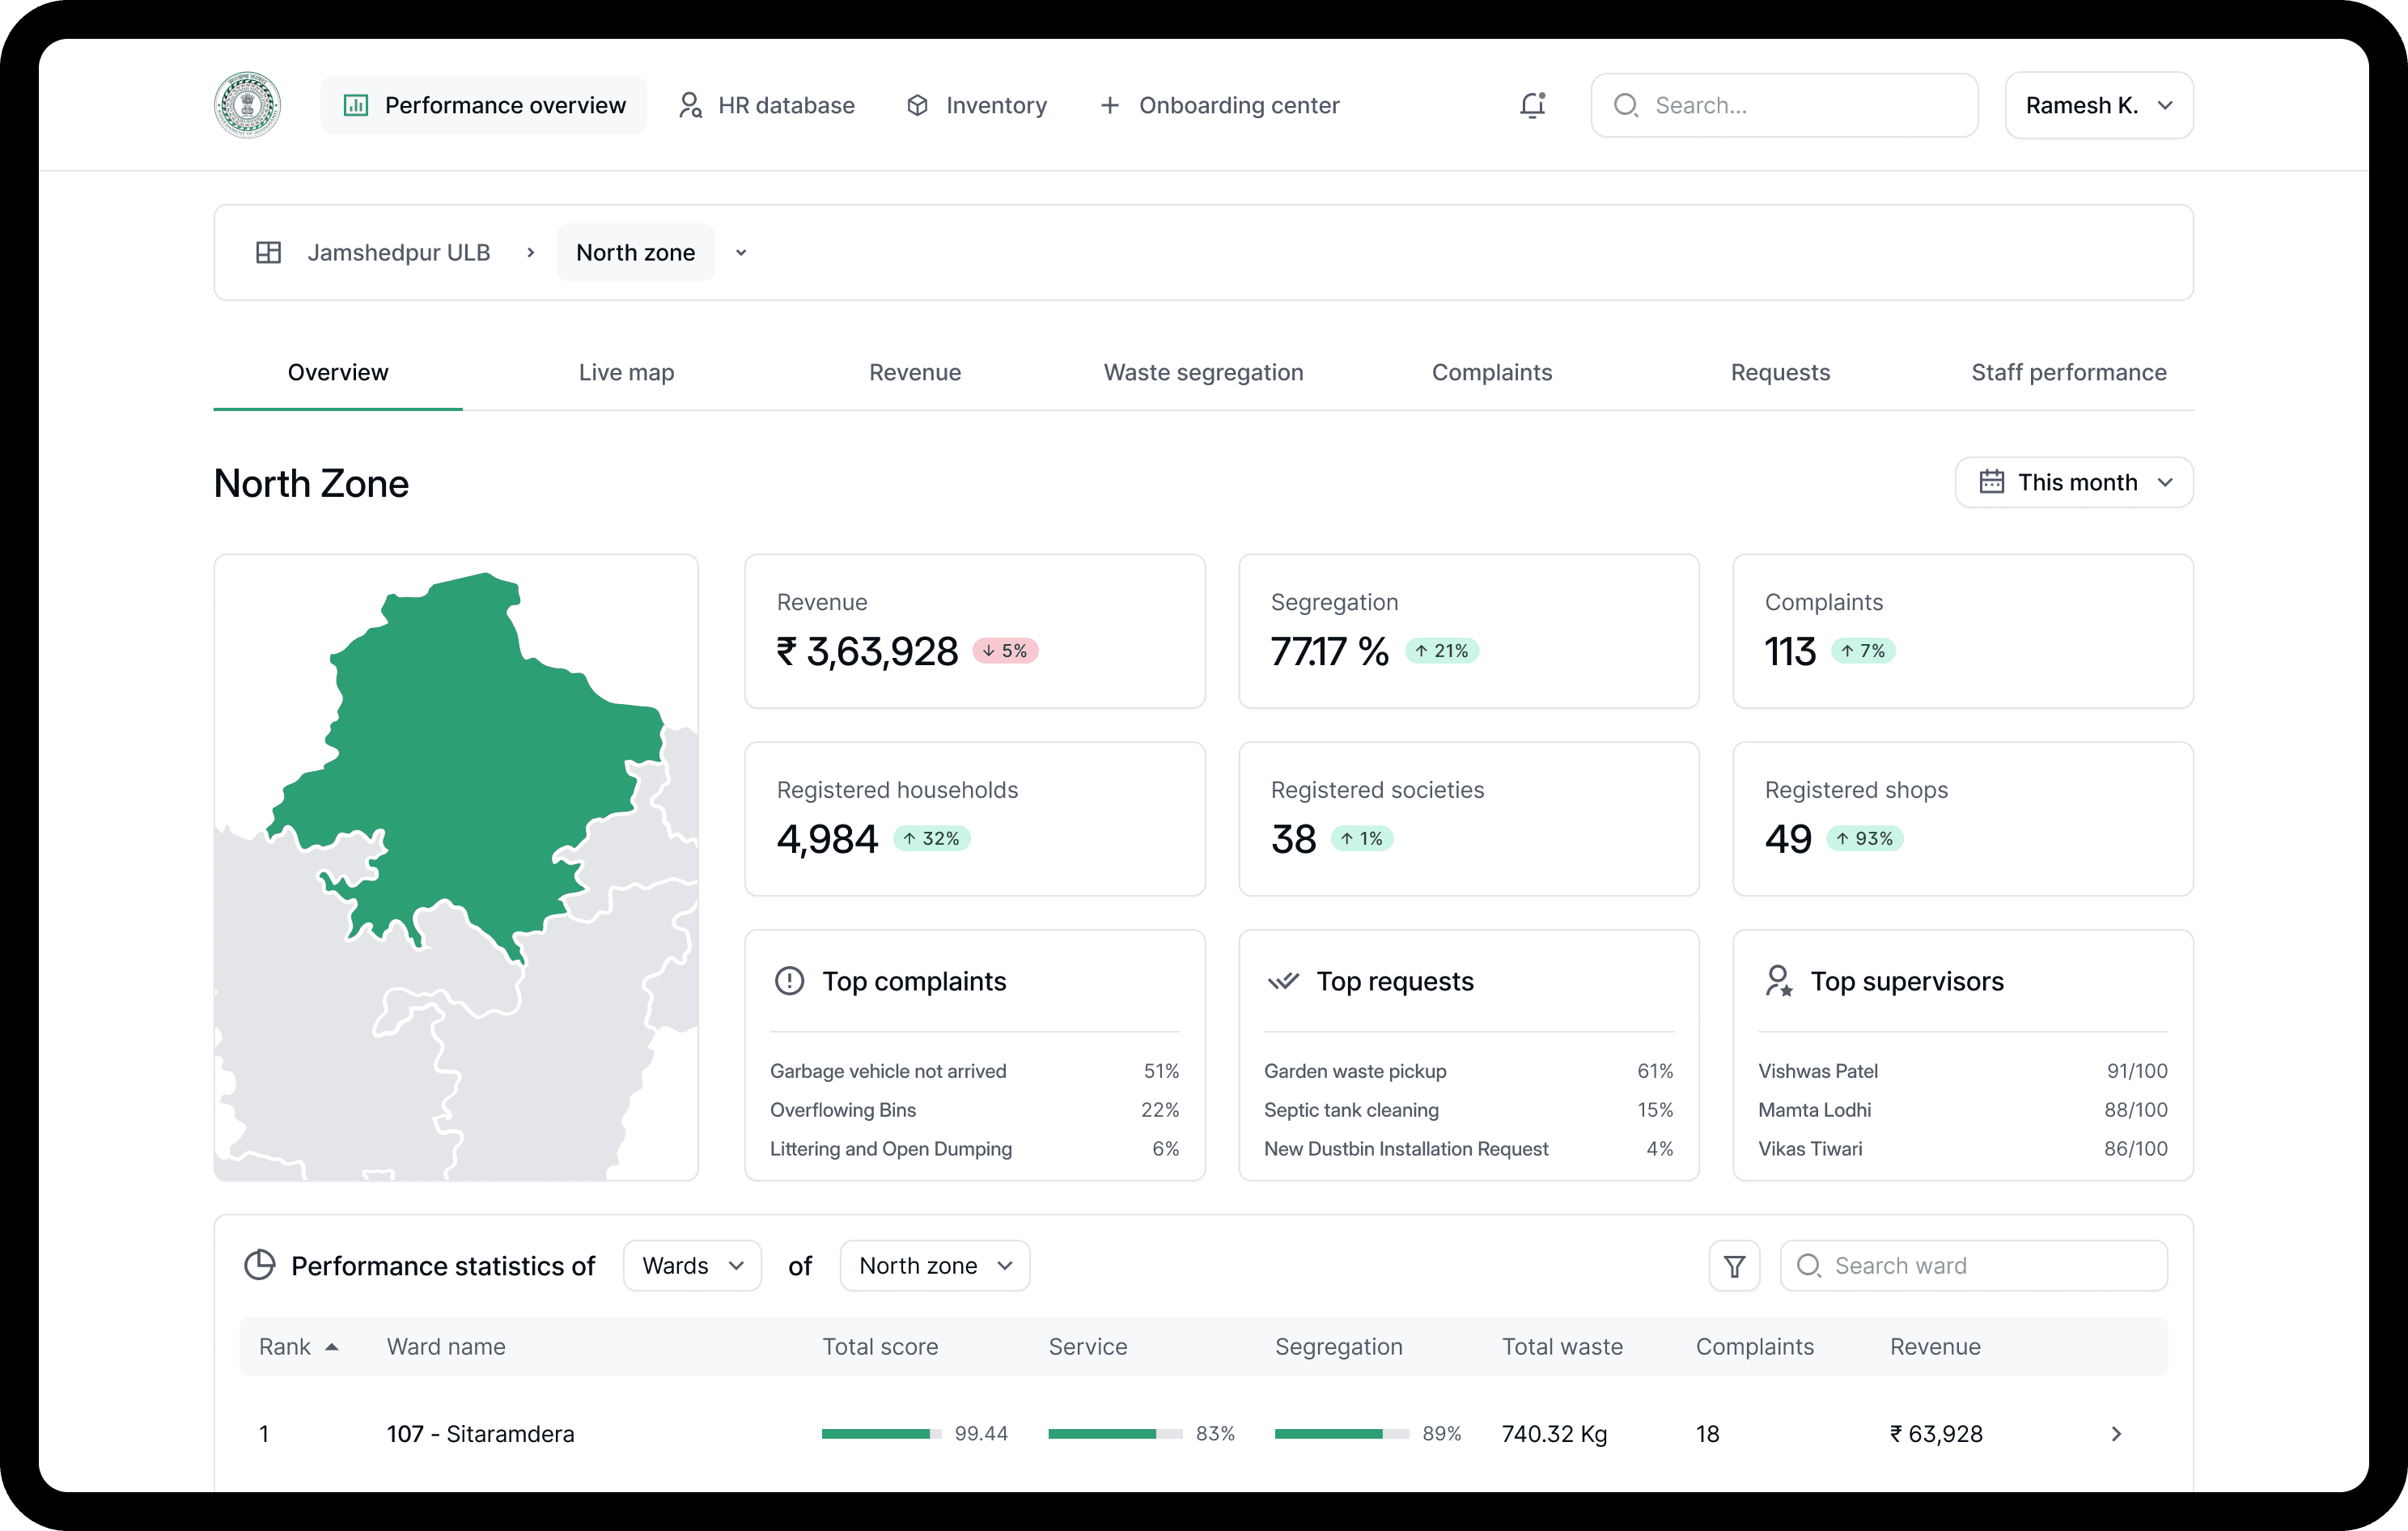
This screen provides a high-level summary of key performance metrics across the selected ULB, zone, ward, or area.
Users can navigate seamlessly using the breadcrumb trail or interact directly with the dynamic map, which highlights the current area in focus.
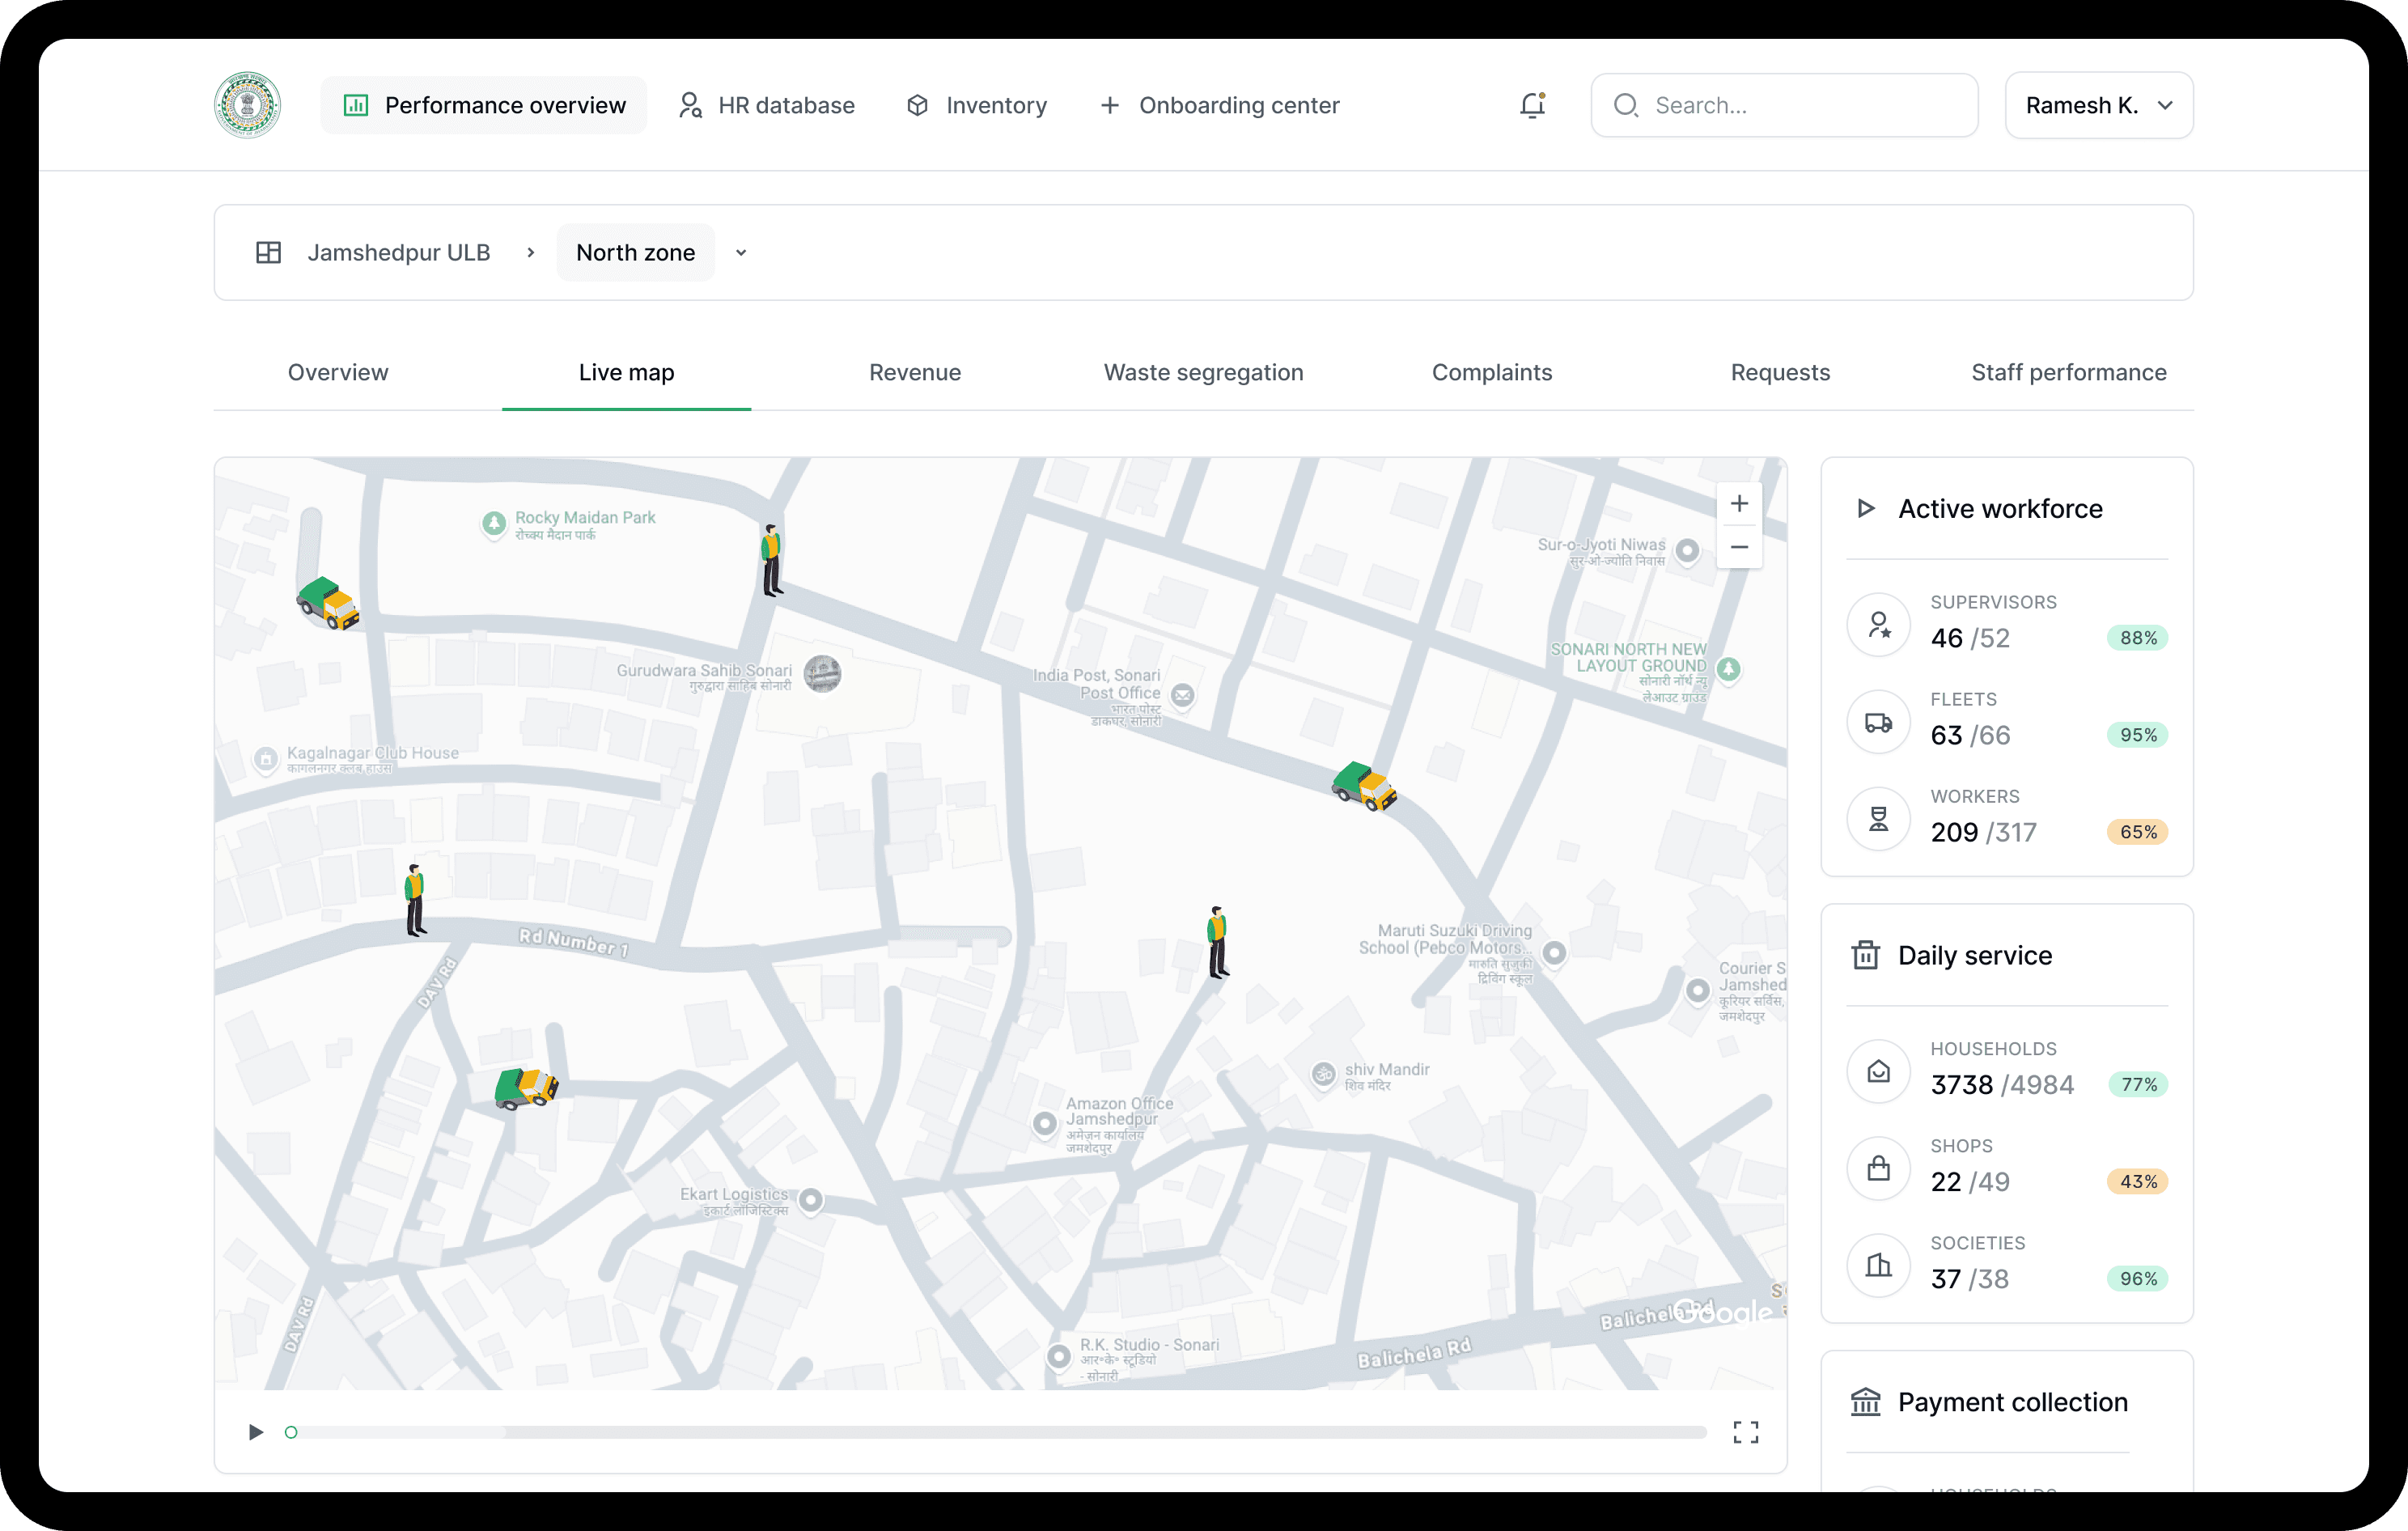
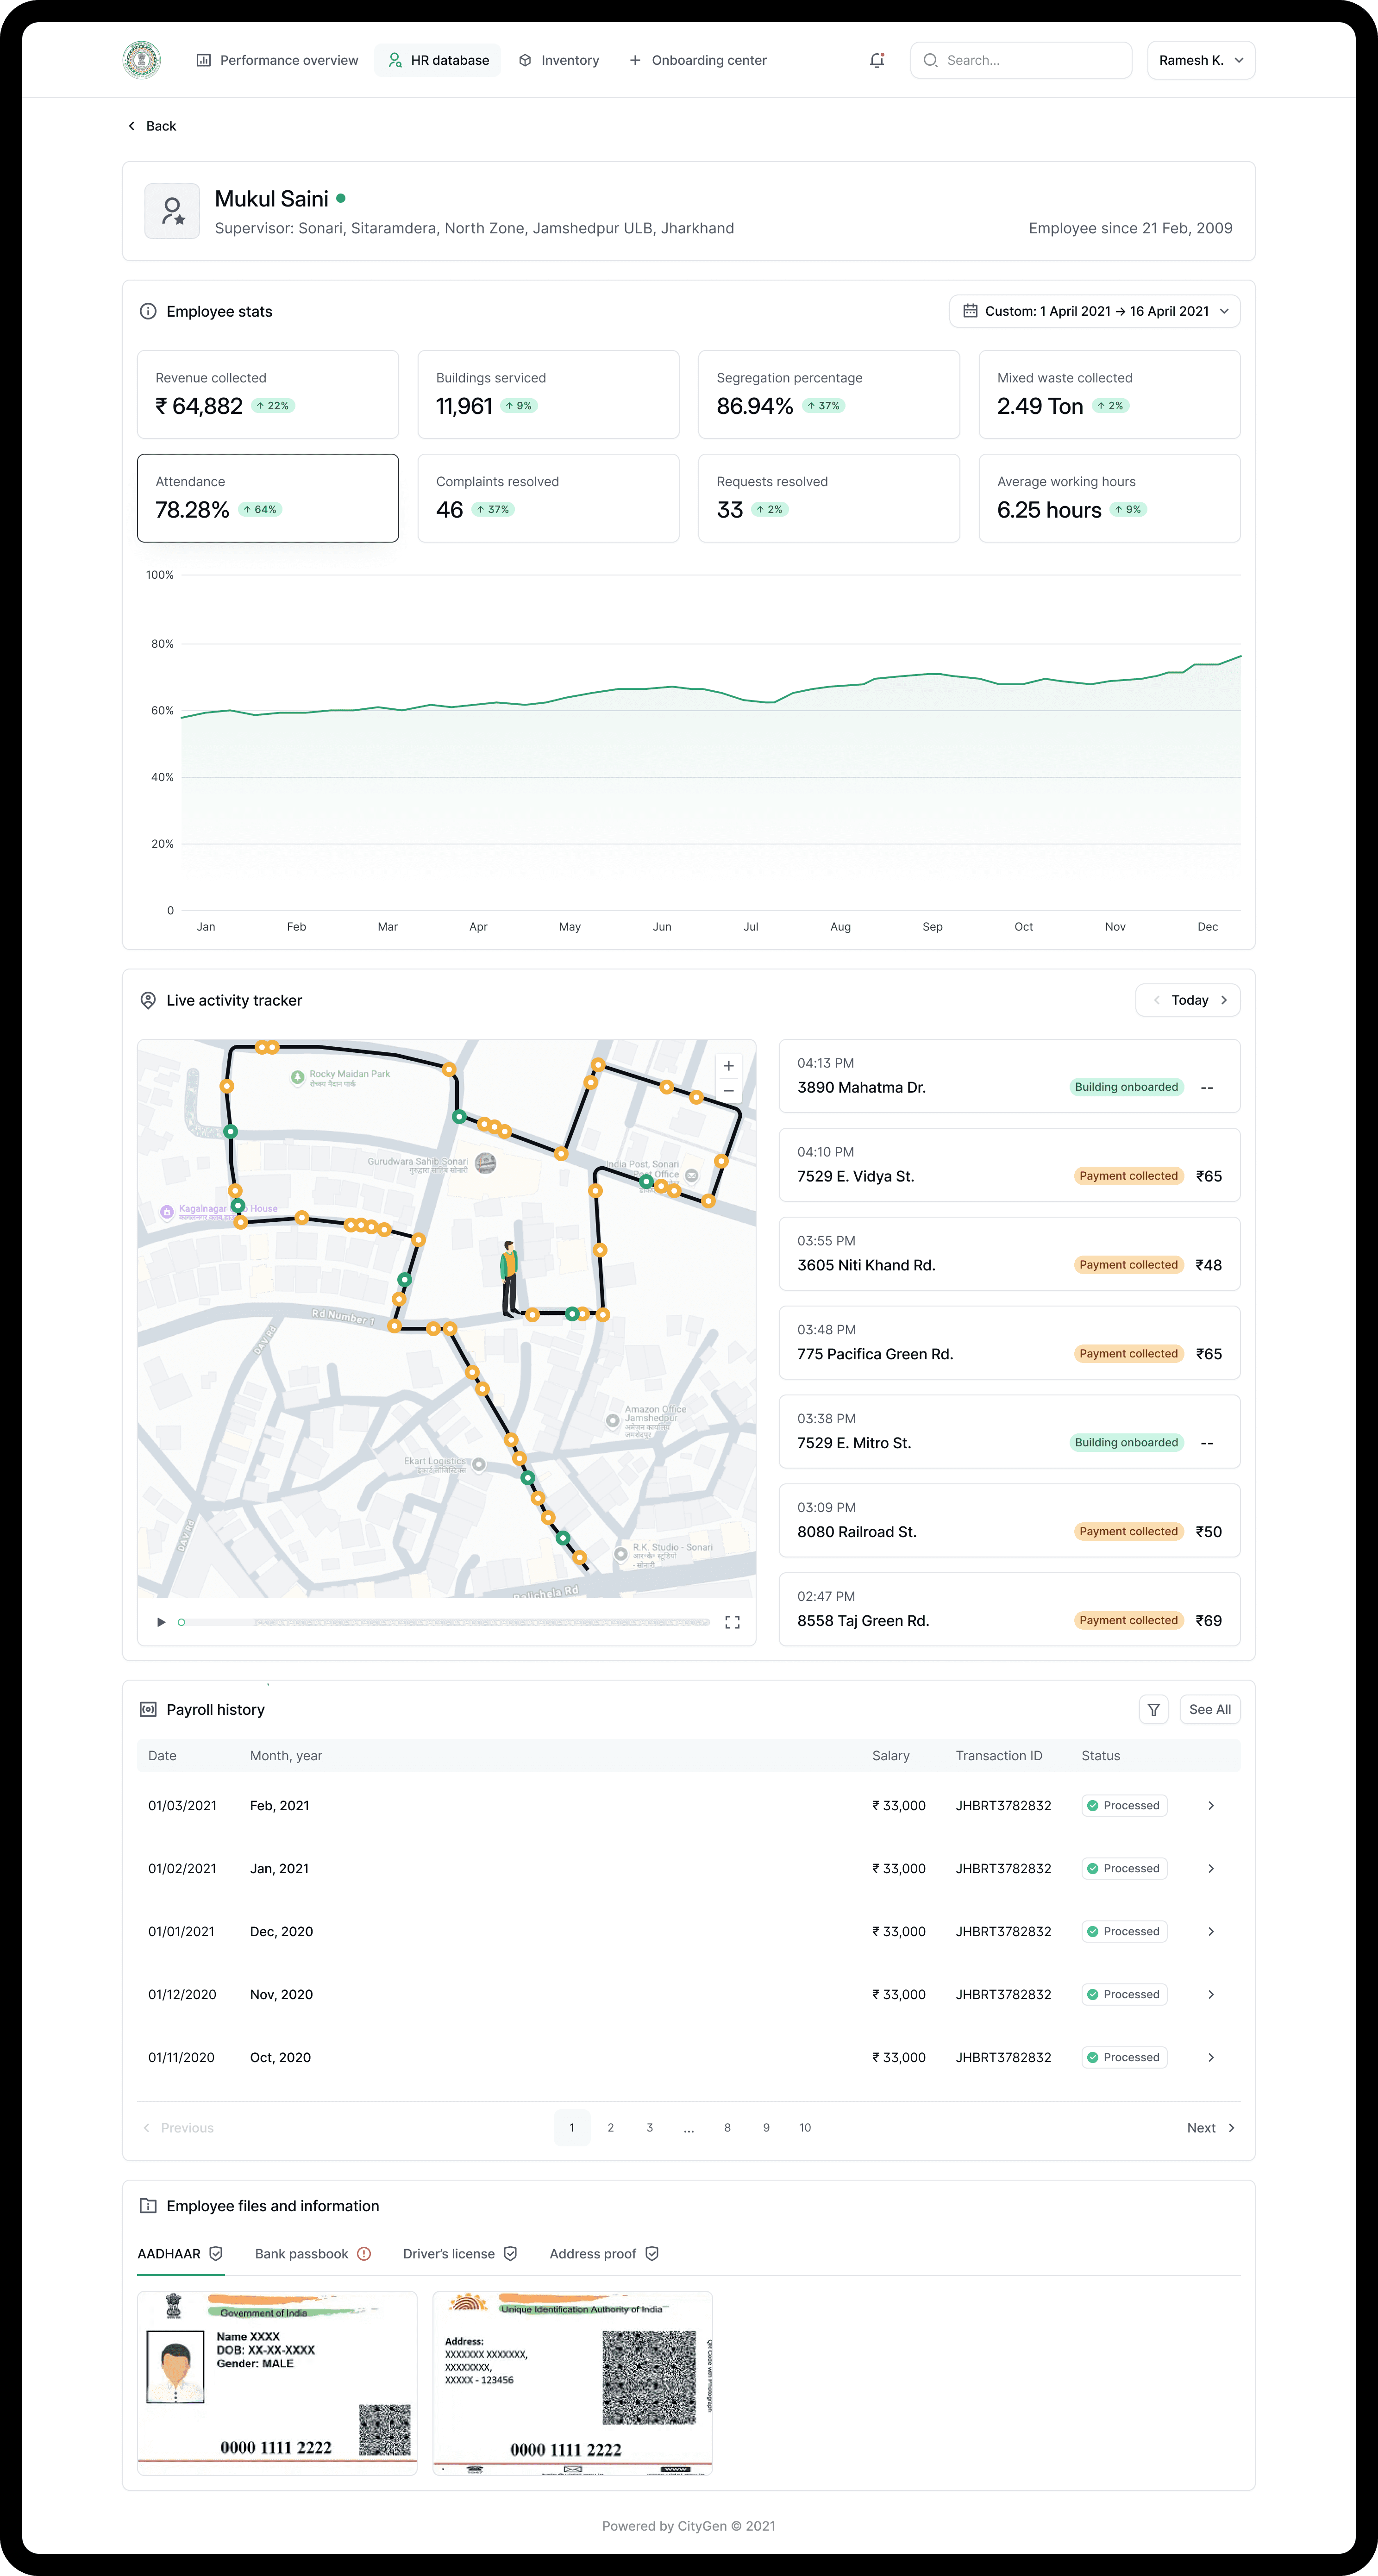
On the dashboard, ULB officers could monitor live activity from the field, including deployed fleet vehicles and sanitation staff.
We integrated Google Maps to provide real-time location playback for any vehicle or worker, across any point in the day.
Officers could replay movement trails, view task completion zones, and filter data dynamically using the right-hand panel, which updated in real time.
The goal wasn’t just visibility. It was operational traceability, something most ULBs had never had before.
Since ULBs collect revenue through multiple channels: daily services for households, societies, shopping complexes, and one-time requests, we designed a dedicated dashboard to give administrators clear, real-time visibility into each stream.
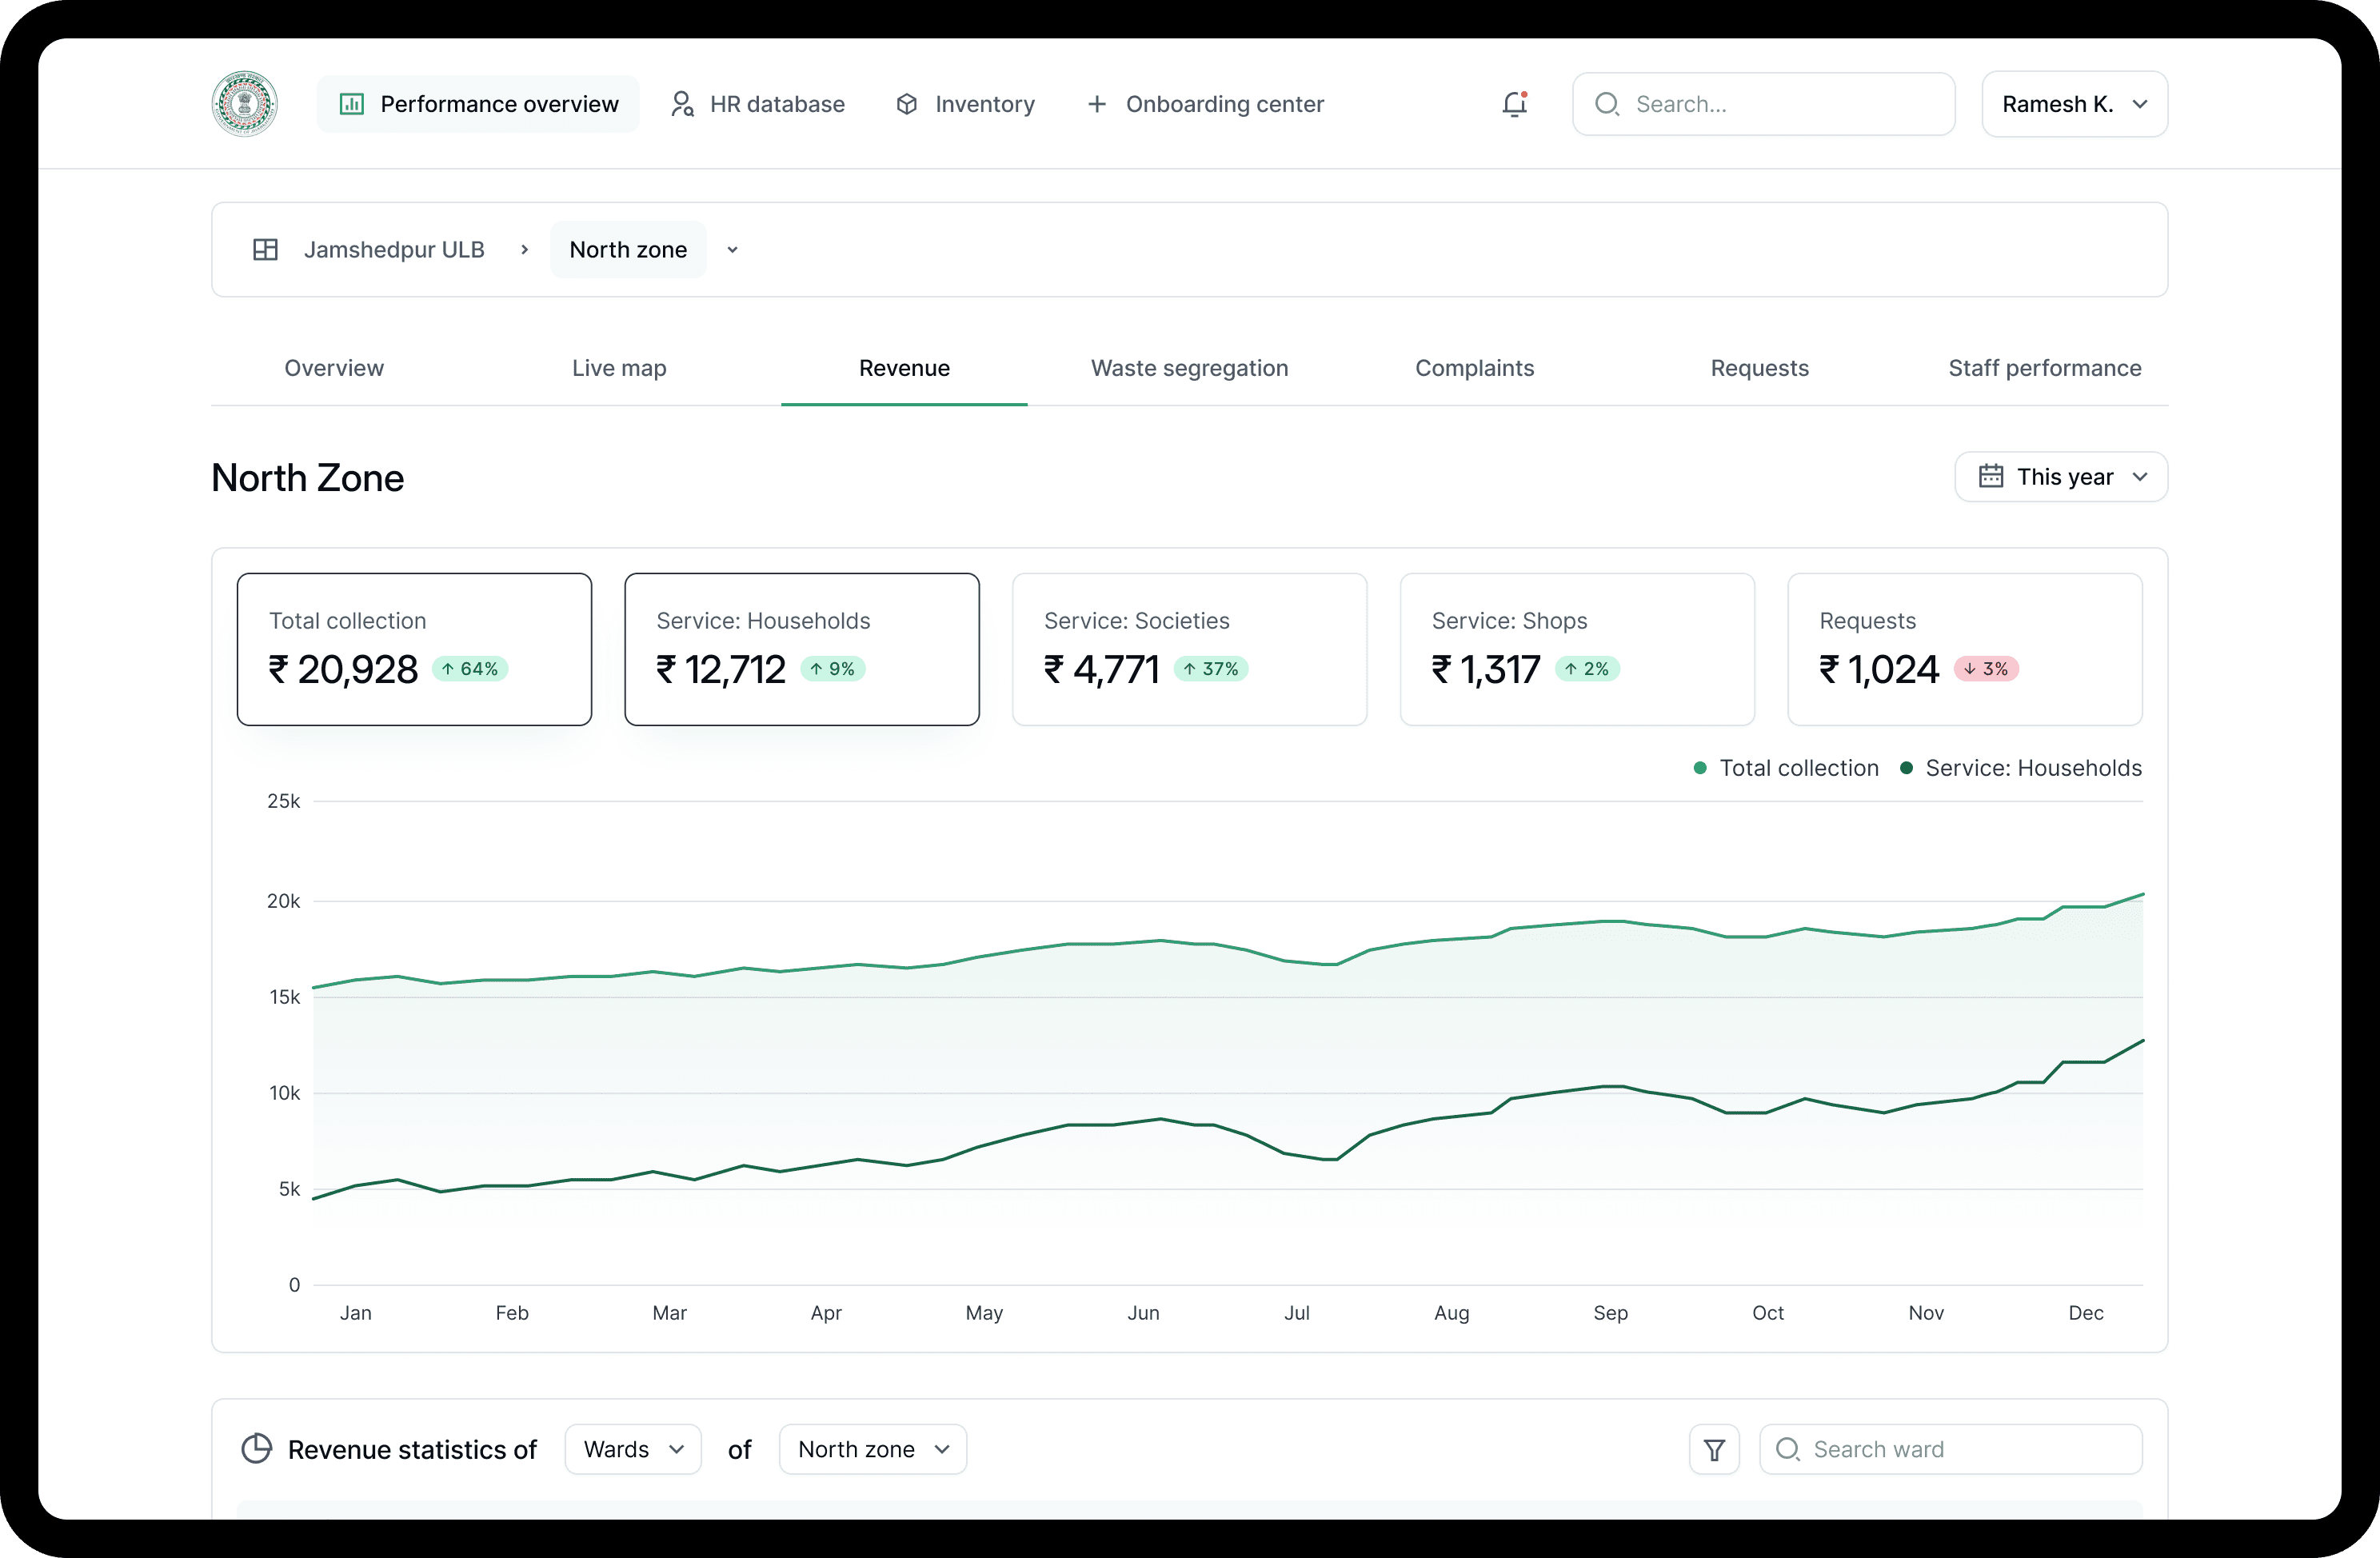
ULBs collect waste across multiple service types: daily pickups for households, bulk services for societies and complexes, and one-time requests.
And because one of the platform’s core goals was to promote waste segregation at the source, we surfaced location-level insights showing which ground crews were driving the most behavior change on the field.
This made it easier for admins to spot what was working, and where to intervene.
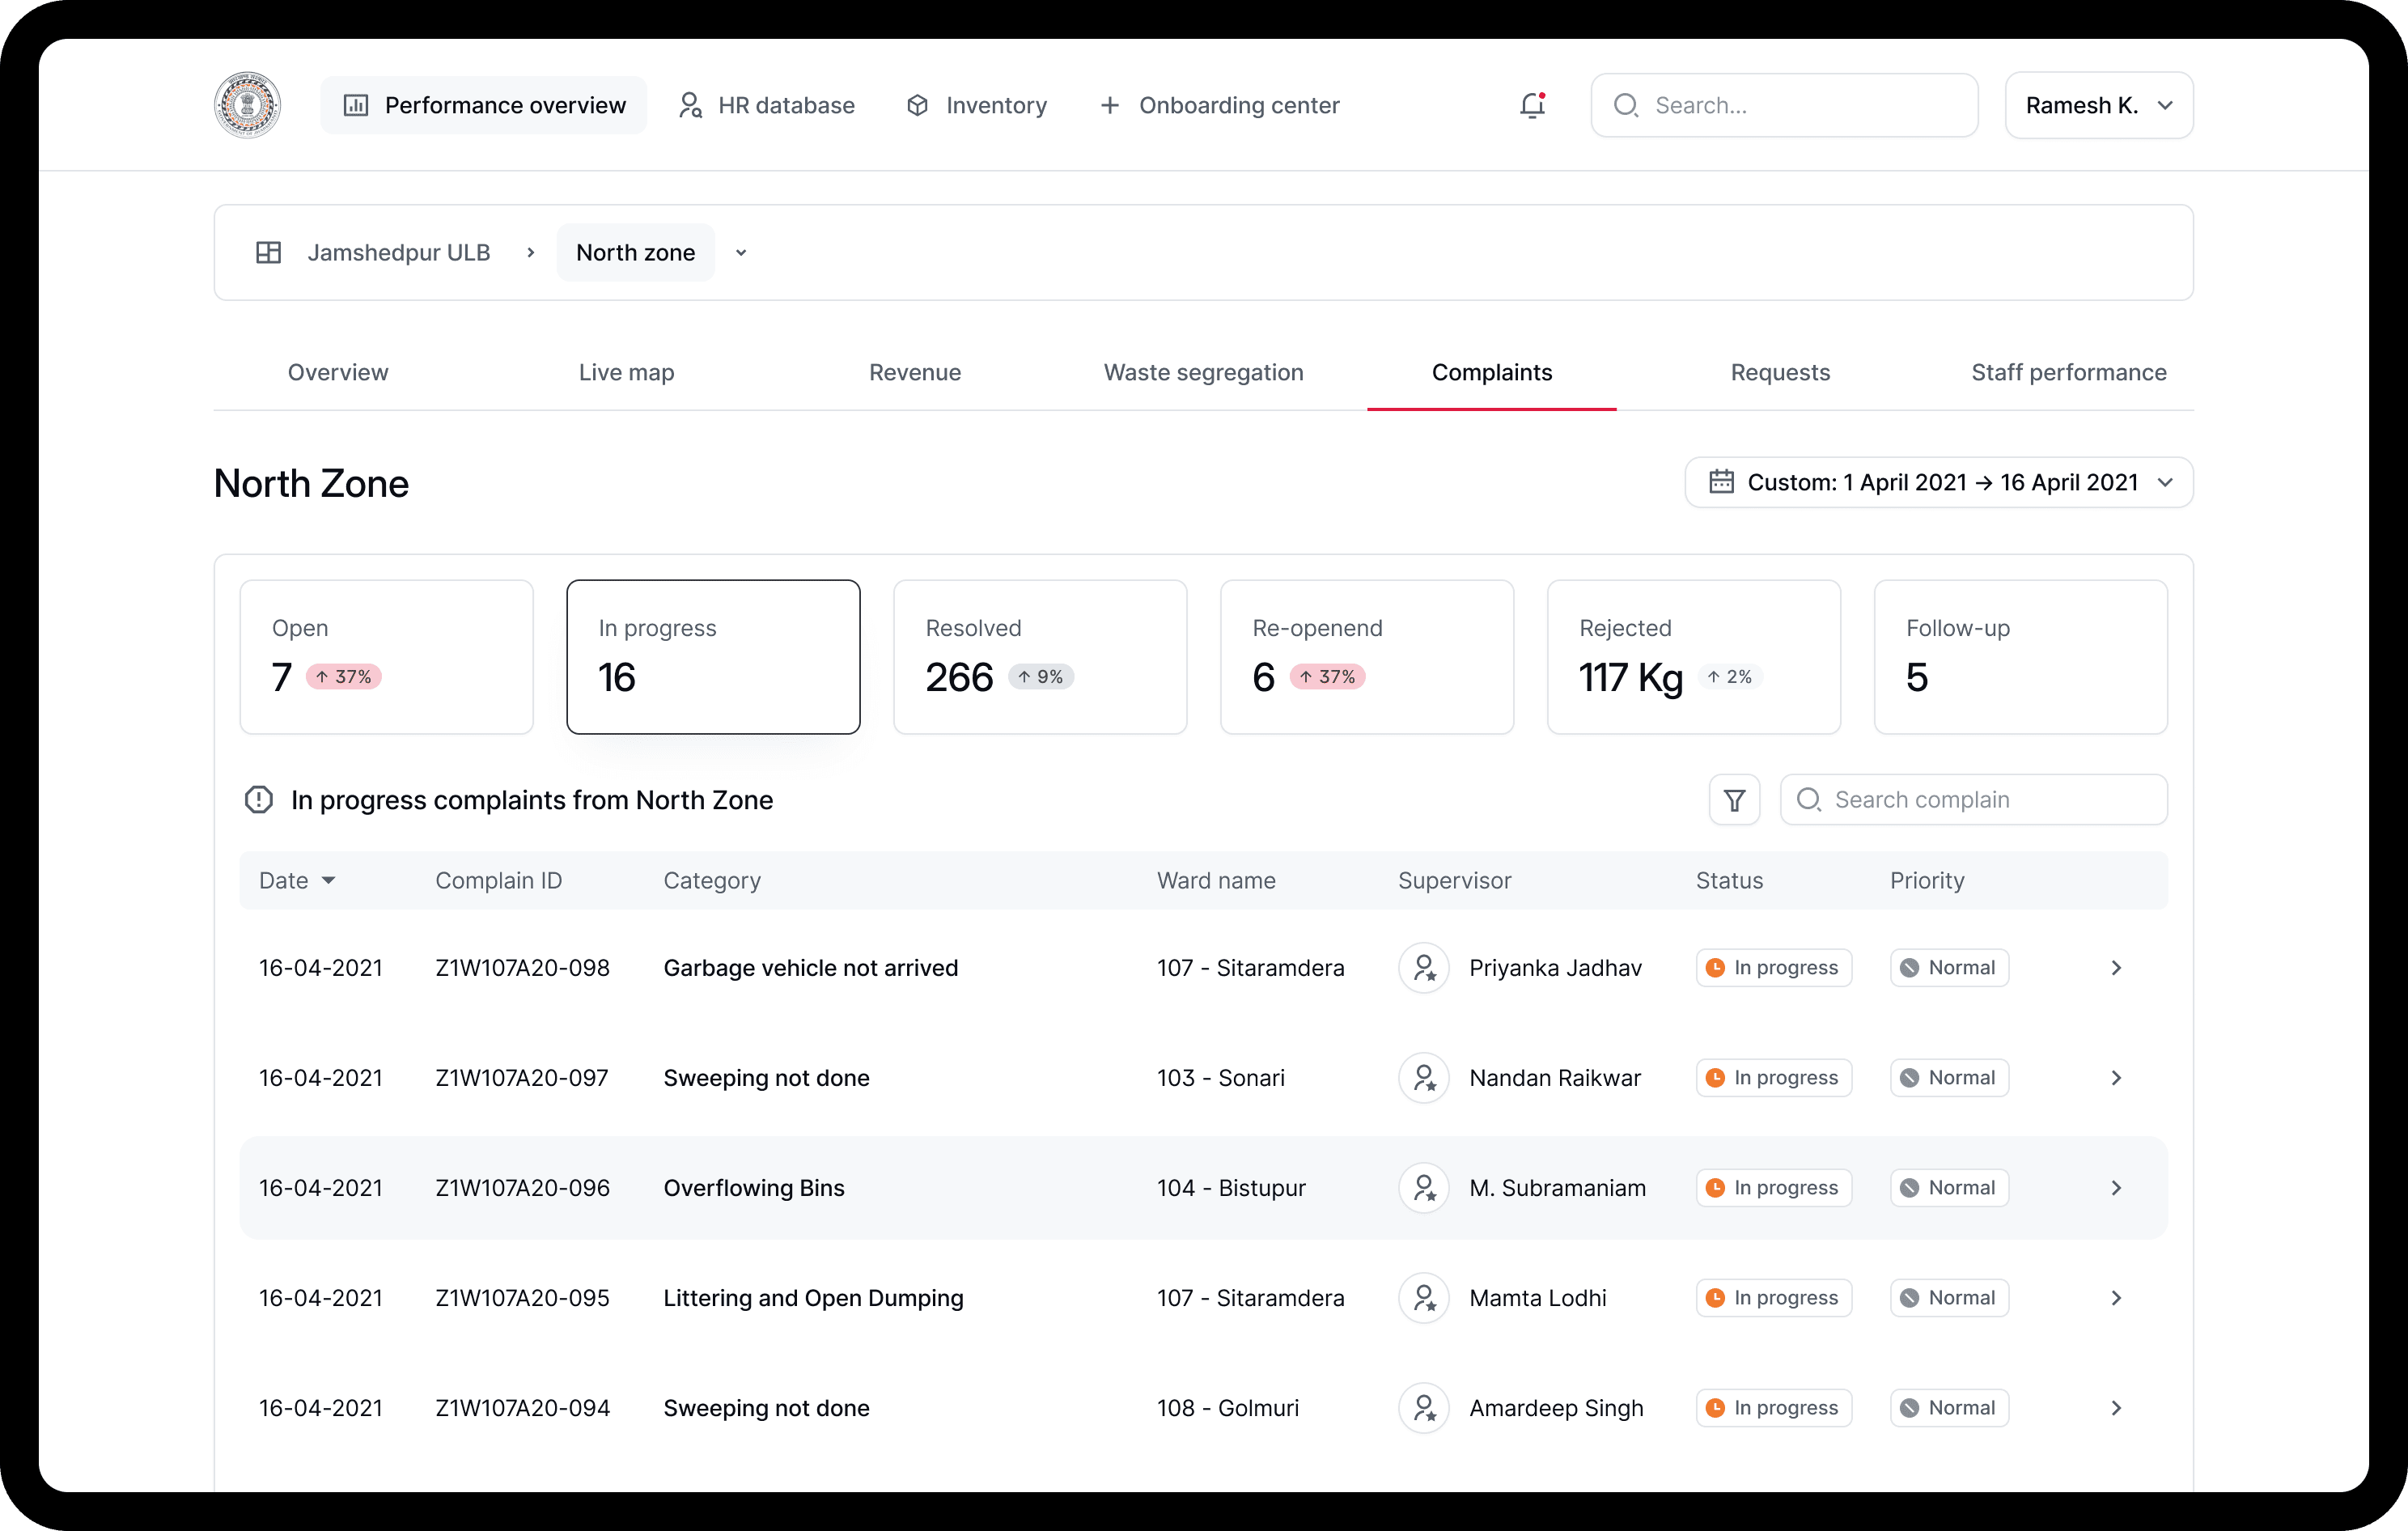
Another highly requested feature was complaints and sanitation issue tracking.
Now that citizens would have a direct channel to report problems, the admin team needed a way to monitor whether those complaints were being resolved, and which ward teams were falling behind.
This wasn’t just a support feature. It was a trust loop.
A system where visibility could drive accountability across teams and zones.
To encourage cleaner, more accountable operations, we proposed a performance scoring system. A simple, visible score out of 100 based on real data.
Scoring inputs included:
Segregation compliance
Revenue collection timeliness
Complaint resolution rates
Task completion across shifts
and others..
The system wasn’t just for ground workers.
We extended it across roles: supervisors, individual workers, sanitation vehicle drivers, area in-charges, ward officers, and zonal leads, ensuring performance visibility at every level of the chain.
The goal: create healthy pressure, surface high performers, and build a foundation for data-informed promotions inside the ULB.
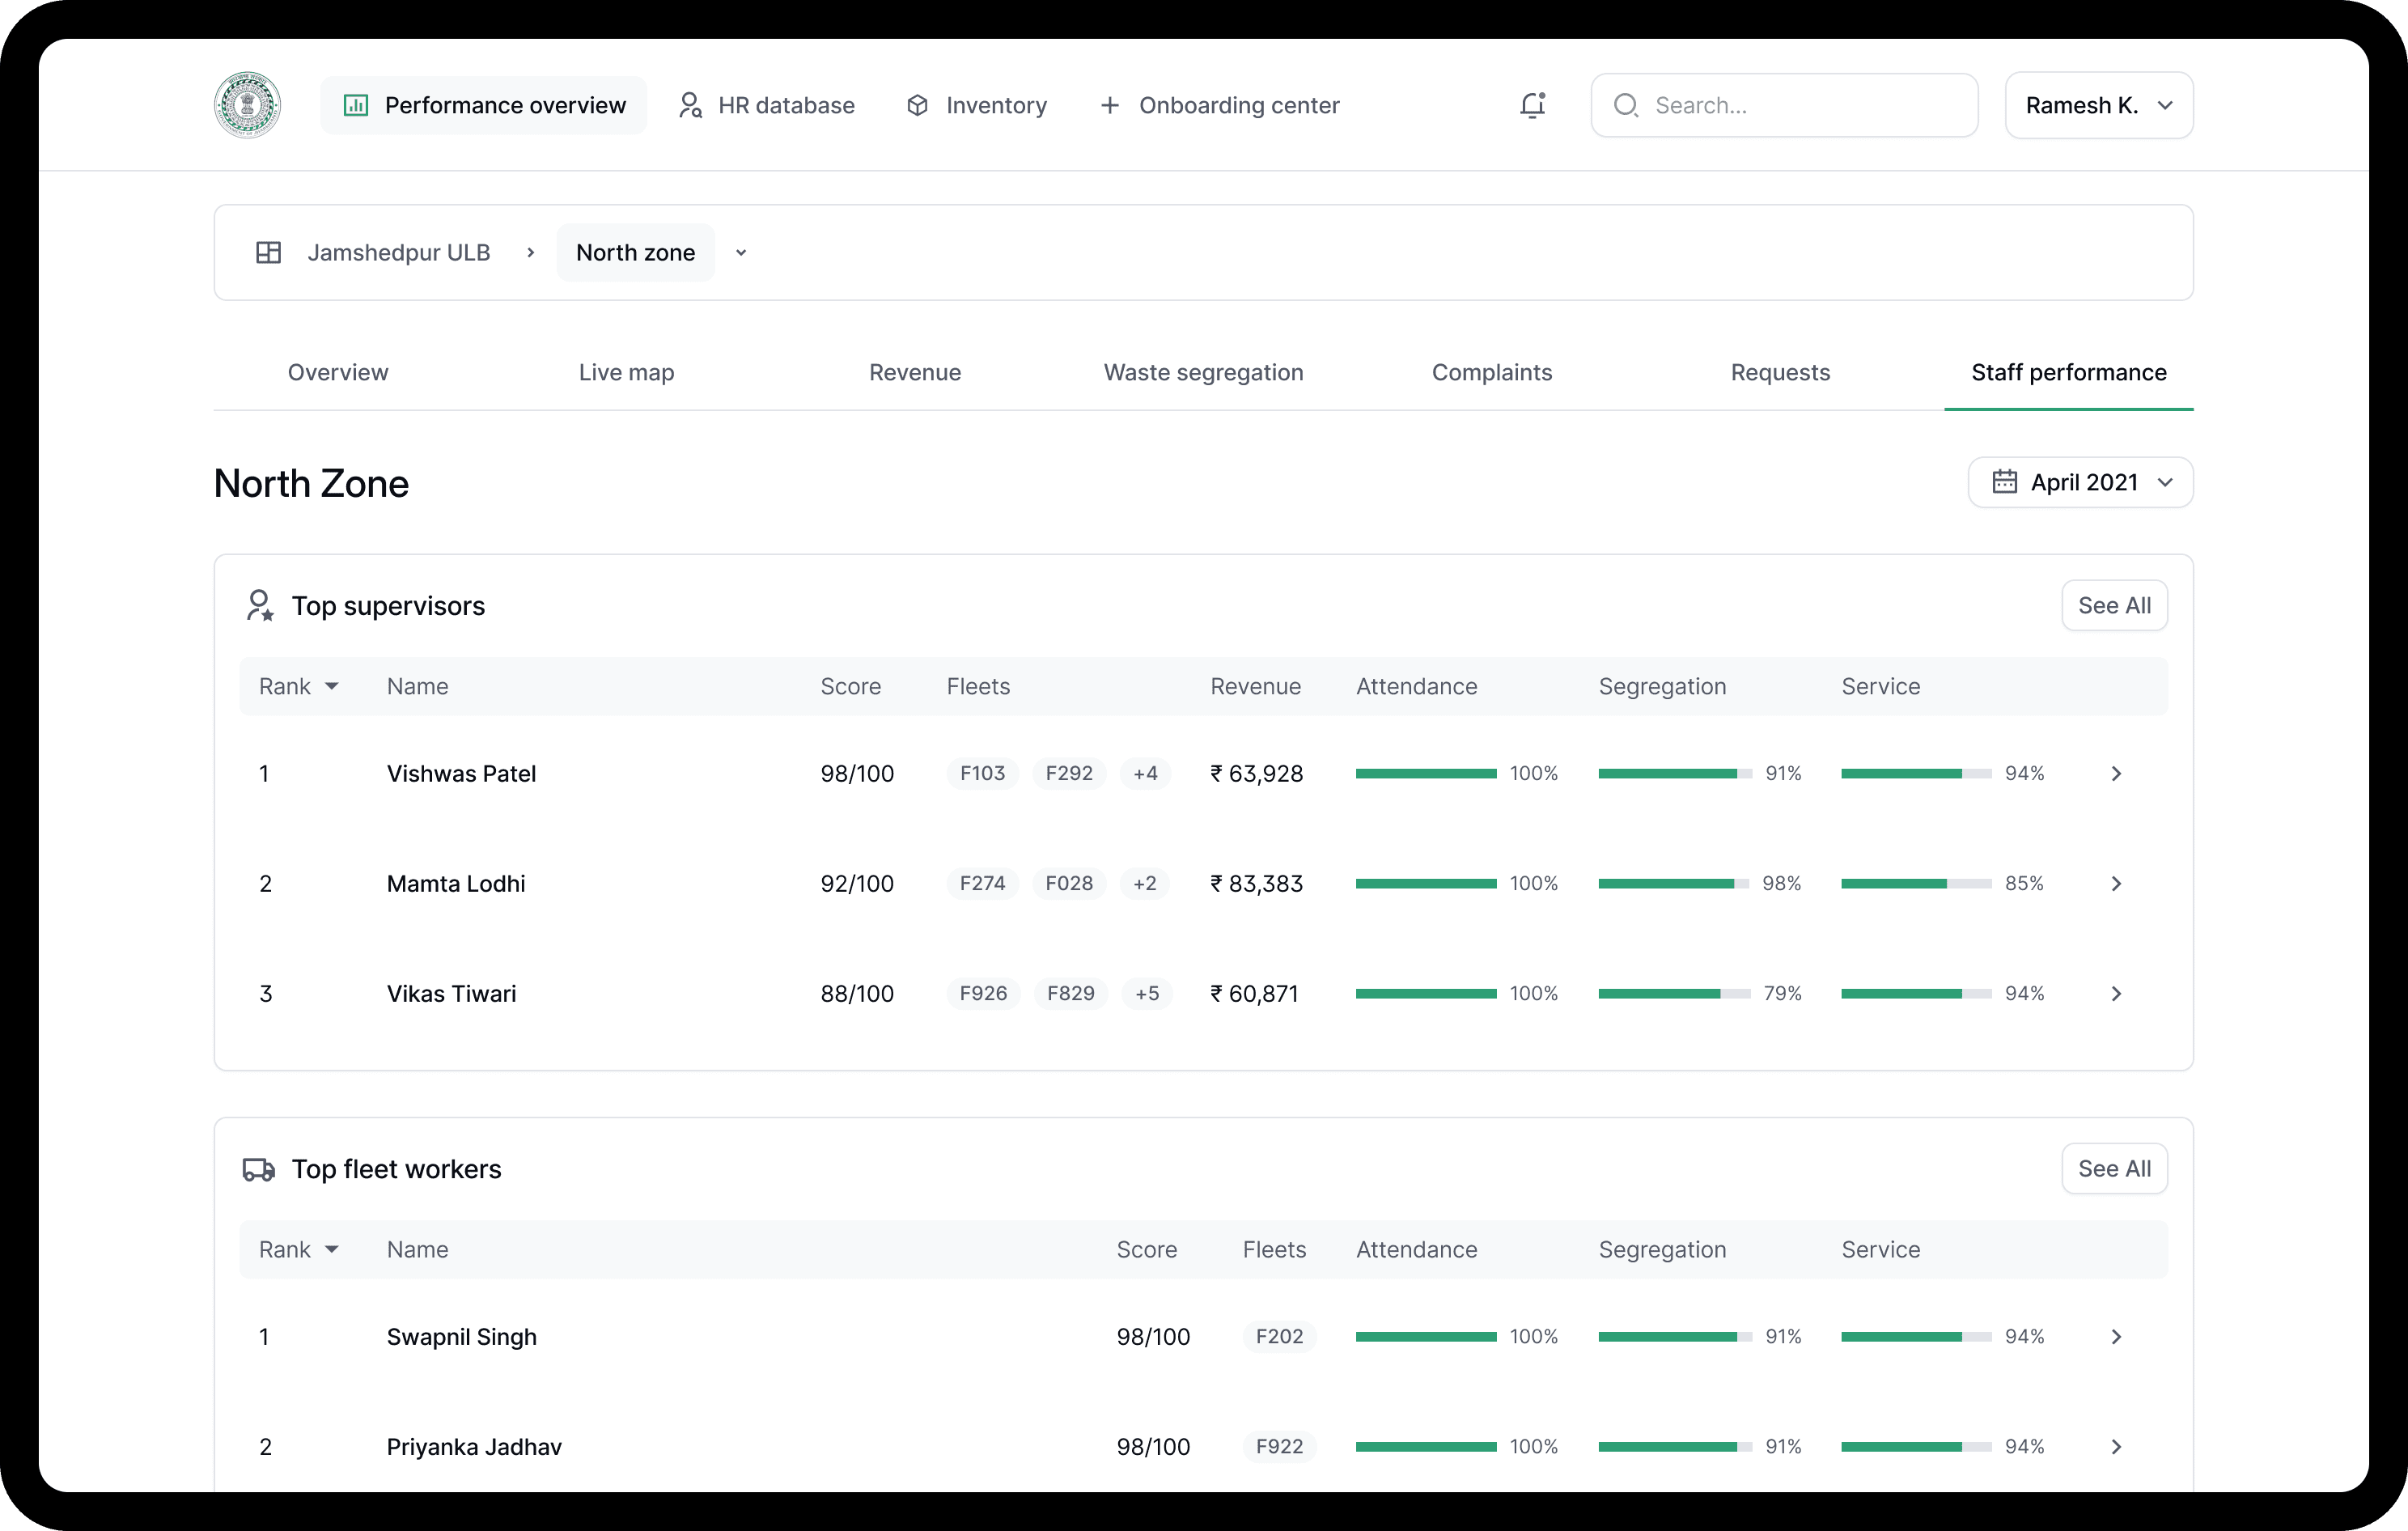
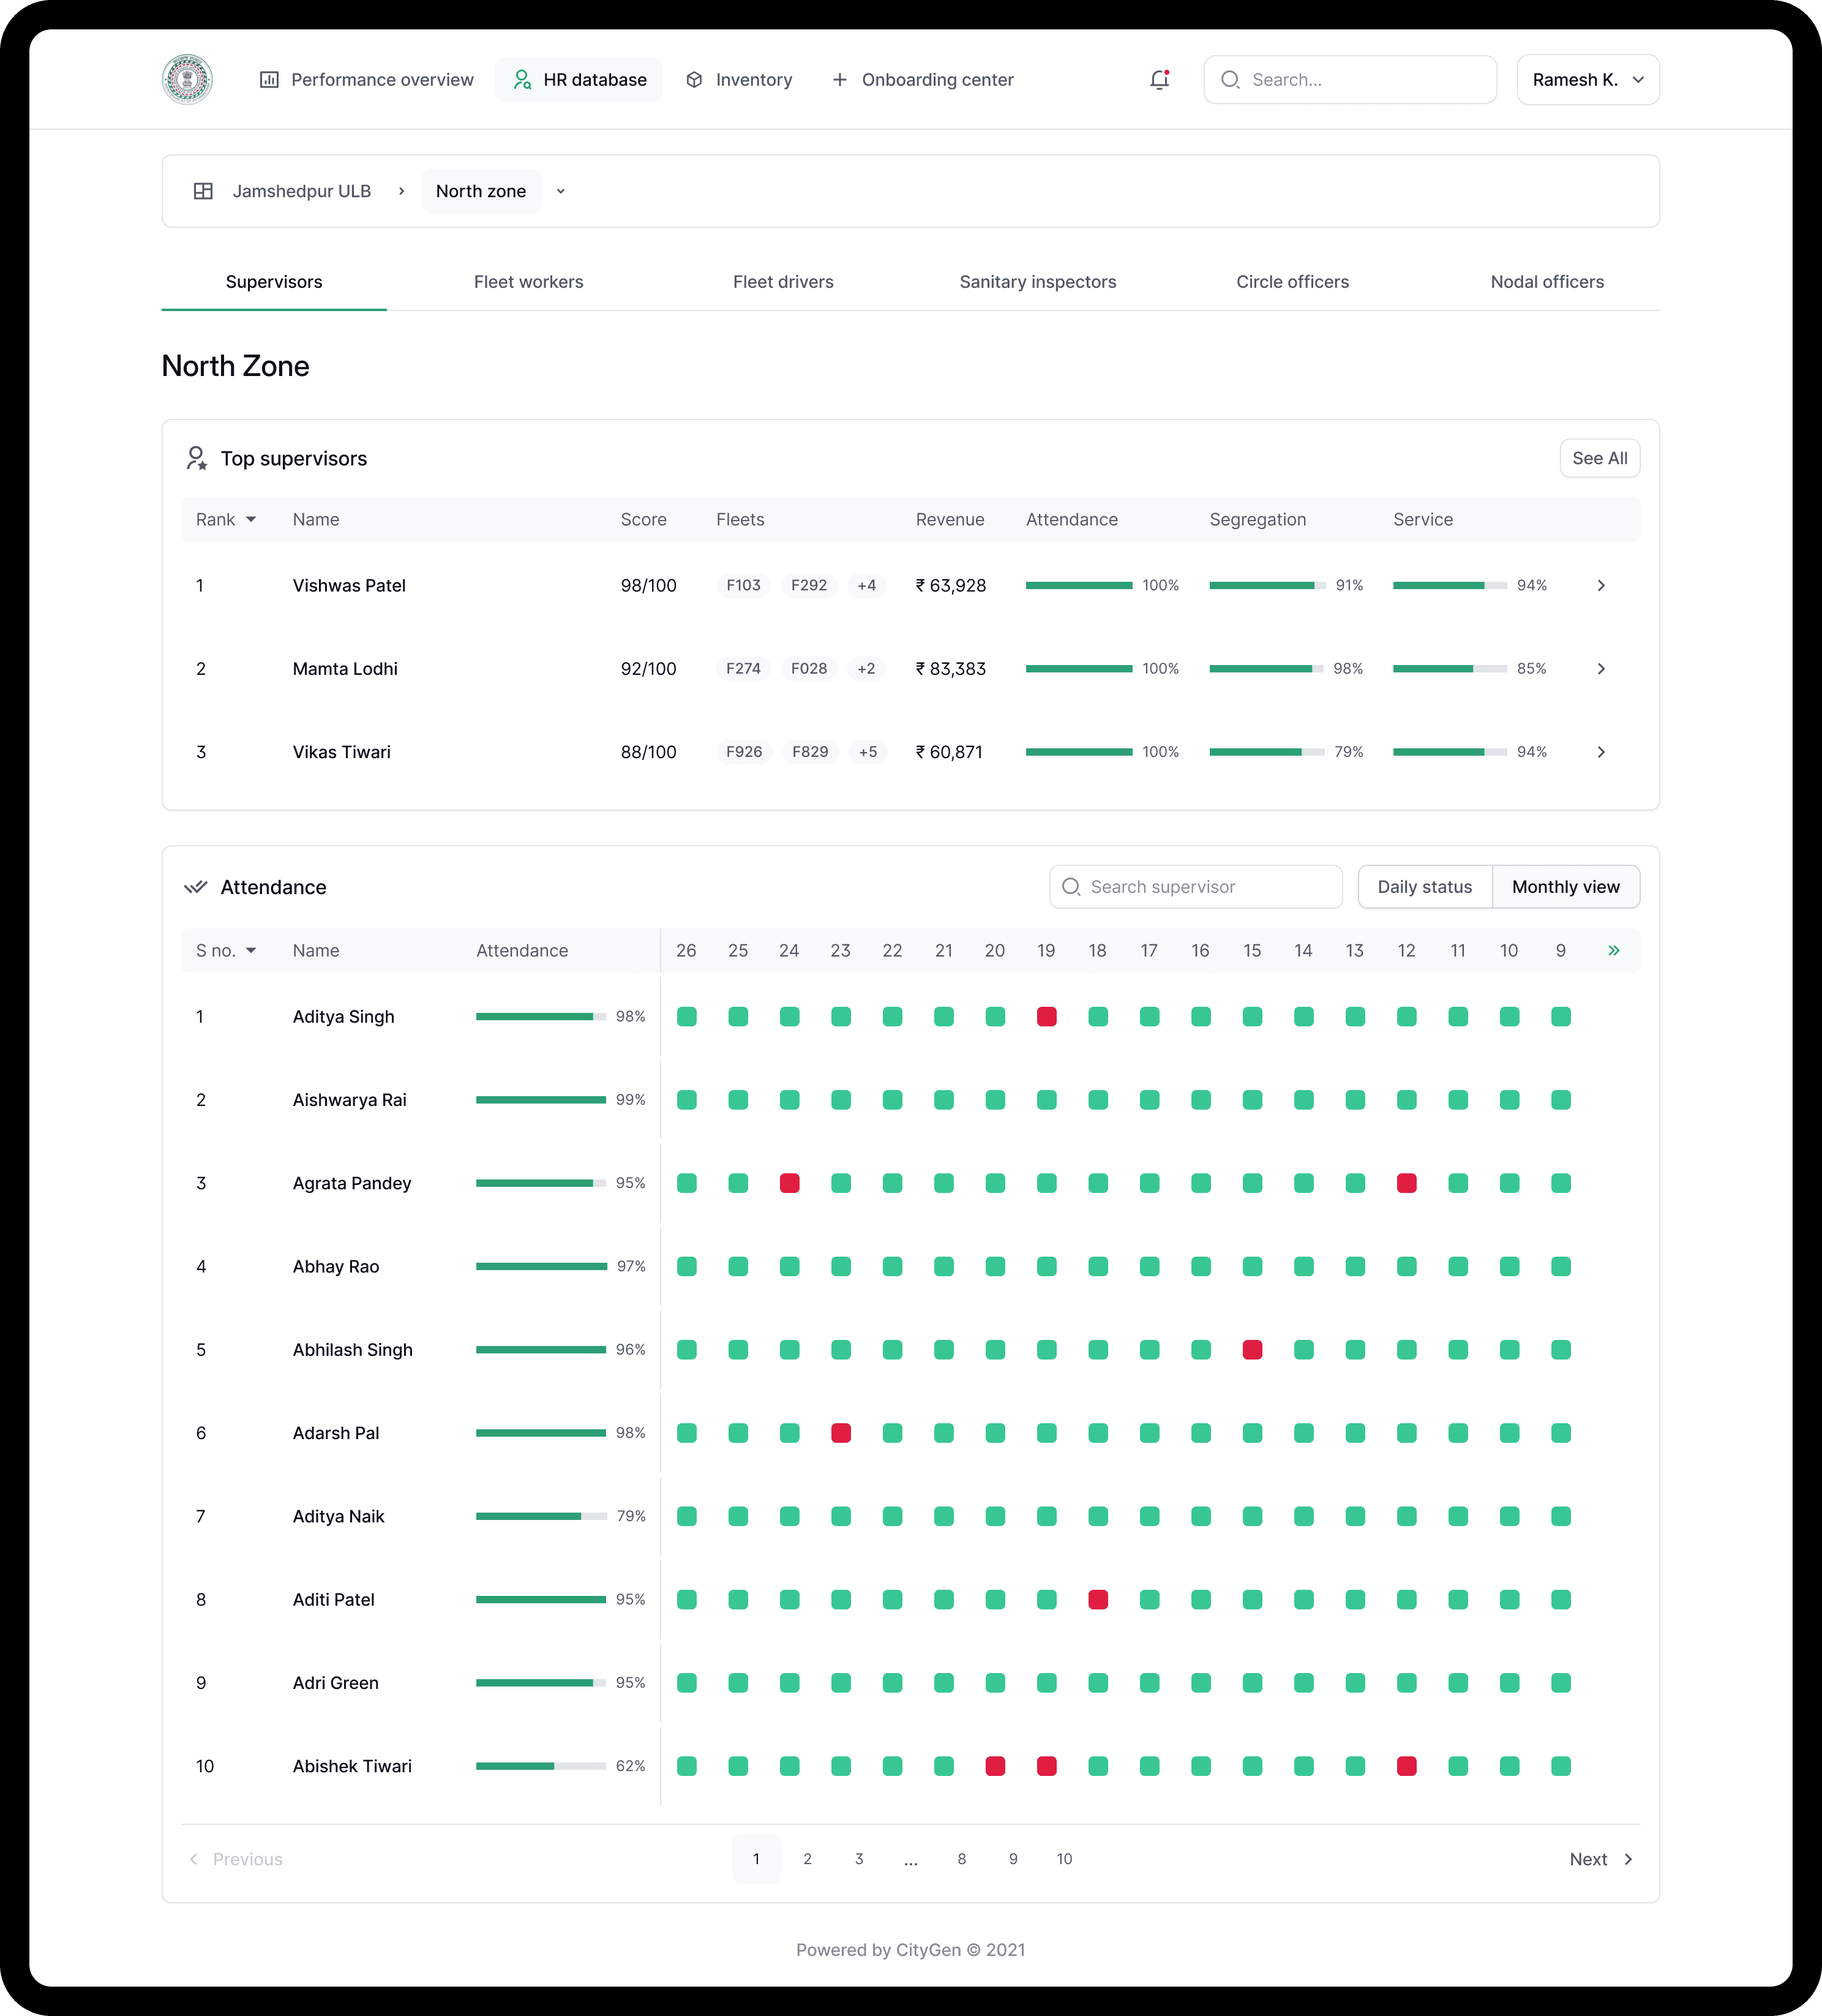
Depending on their role and access level, users could view performance statistics, attendance records, and profile details for their direct reports.
The final section of the dashboard focused on inventory management; digitizing fleet data, equipment records, and supplies to give ULB officials a clear, high-level view of operational assets.
Challenges faced
Being unfamiliar with practices, my biggest challenge was to learn them first. Only after detailed research was I able to find the best solutions.
Onboarding 18 entities via form flows forced creative simplification because the user (supervisors) were not academically inclined, which required radically simplified flows
I had never designed an enterprise-grade dashboard before. So, I had to first learn about all of the UI guidelines to create a more breathable design.
The Live Map view was a system design challenge in itself; balancing real-time data with clarity
Reflection
This project pushed me to think beyond UI into system design, operational modeling, and civic behavior.
Designing for ULBs wasn’t about “delight.”
It was about structure, traceability, and trust.
The platform is now in development for deployment with the Jamshedpur Urban Local Body. If successful, it could scale to hundreds of municipalities and quietly reshape how millions of people experience civic service.
And I got to design the first version.